In February we added new comparison blocks to the sharing server IsGreater Percentile/Is Lower Percentile. These comparison blocks allow you to create rules based on the percentile rank of a given indicator.
You can download them here: https://strategyquant.com/codebase/is-greater-is-lower-percentile-rank-comparison/
In this section you can find various snippets – indicators, databank snippets, custom analysis and other very useful additions to StategyQuant X.
Let’s talk about what percentile rank is for:
Percentile rank is a common method of summarizing and comparing data in statistics. It provides a way to understand how a particular value compares to the rest of the values in a set.
Percentile rank is a measure that indicates the relative standing of a value within a set of values. It is expressed as a percentage, indicating the percentage of values in the set that are equal to or less than the value in question. For example, if a value has a percentile rank of 80, it means that 80% of the values in the set are equal to or less than that value. Percentile ranks can be calculated by first arranging all the values in a set in increasing order and then determining the fraction of values that are less than the value in question. The fraction is then multiplied by 100 to convert it to a percentage. Percentile rank is a measure that indicates the relative standing of a value within a set of values. It is expressed as a percentage, indicating the percentage of values in the set that are equal to or less than the value in question. For example, if a value has a percentile rank of 80, it means that 80% of the values in the set are equal to or less than that value.
In trading, percentile rank is used to measure the performance of a security or portfolio relative to a benchmark or a peer group. It is used as a means of evaluating the returns of a security or portfolio by comparing it to the returns of similar securities or portfolios. For example, if a stock has a percentile rank of 75, it means that its return is better than 75% of the stocks in the same sector or market. If a portfolio has a percentile rank of 90, it means that its return is better than 90% of similar portfolios with similar investments. Percentile rank can be used as a technical indicator in trading by comparing the current value of an indicator to its historical value . This provides insight into whether an indicator is overbought or oversold based on its relative performance compared to its own historical data. For example, if an indicator current value has a percentile rank of 95, it means that its current price is higher than 95% of its historical values . This could indicate that the indicator is overbought and may be due for a correction. On the other hand, if an indicator’s current value has a percentile rank of 5, it means that its current value is lower than 5% of its historical values . This could indicate that the security is oversold and may be due for a rally.
What are Comparison blocks?
Comparison blocks are are used in SQX to compare values of indicators, or other values.
These comparison blocks are used in the Genetic builder or in the Algo Wizard.
Examples:
- RSI is rising 2 bar 1 bar ago
- RSI is falling 2 bars 1 bar ago.
- RSI is Greater than 50
- RSI is Lower than 50
These are the building blocks for strategy construction. These are operators that compare or evaluate the conditions from which the rules for entering or exiting a trade are created.
For example is Greater / is Lower and these blocks have in their parameters indicator values or price patterns that compare each other. Crosses Above/Crosses Below are blocks which are true if the Indicator crosses specific value.
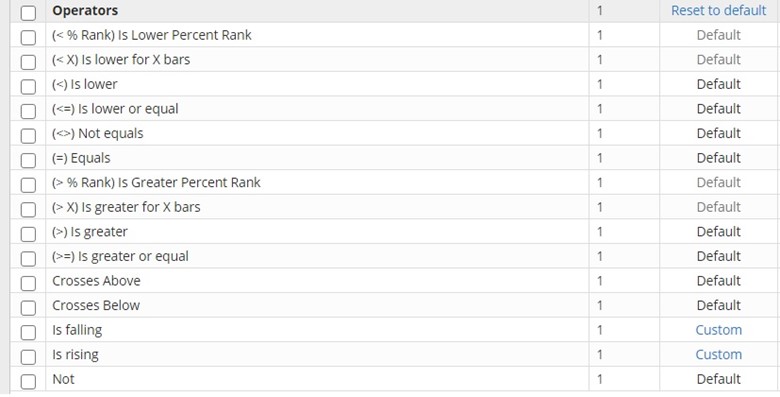 Comparison block in StrategyQuant X
Is Greater / Is Lower Percent Rank comparison blocks
Is Greater Percent Rank is a comparison block that has a true/false value and indicates whether the value of the indicator is higher or equal than x percent of its values in the past
Is Lower Percent Rank is a block that has a true/false value and indicates whether the value of the indicator is lower or equal than x percent of its value in the past.
So, if we have a block IsGreaterPercentile(RSI(14,10)) > 50, it means that the RSI with the period 14 is higher or equal than 50% percent of the RSI for the last 10 bars.
Conversely, if we have IslowerPercentile(RSI(14,10))< 50, this block means that the RSI with period 14 is less or equal than 50% percent of the RSI for the last 10 bars.
How can we use these blocks in StrategyQuant X?
1. AlgoWizard – Creating strategies
Algowizard is a tool that helps you to create algorithmic trading strategies in a simple way without any programming. It allows you to backtest them right away and then export the strategy code to your favorite trading platform and trade it on demo or live account. More about Algowizard Editor you can find here: https://algowizard.io/documentation/.
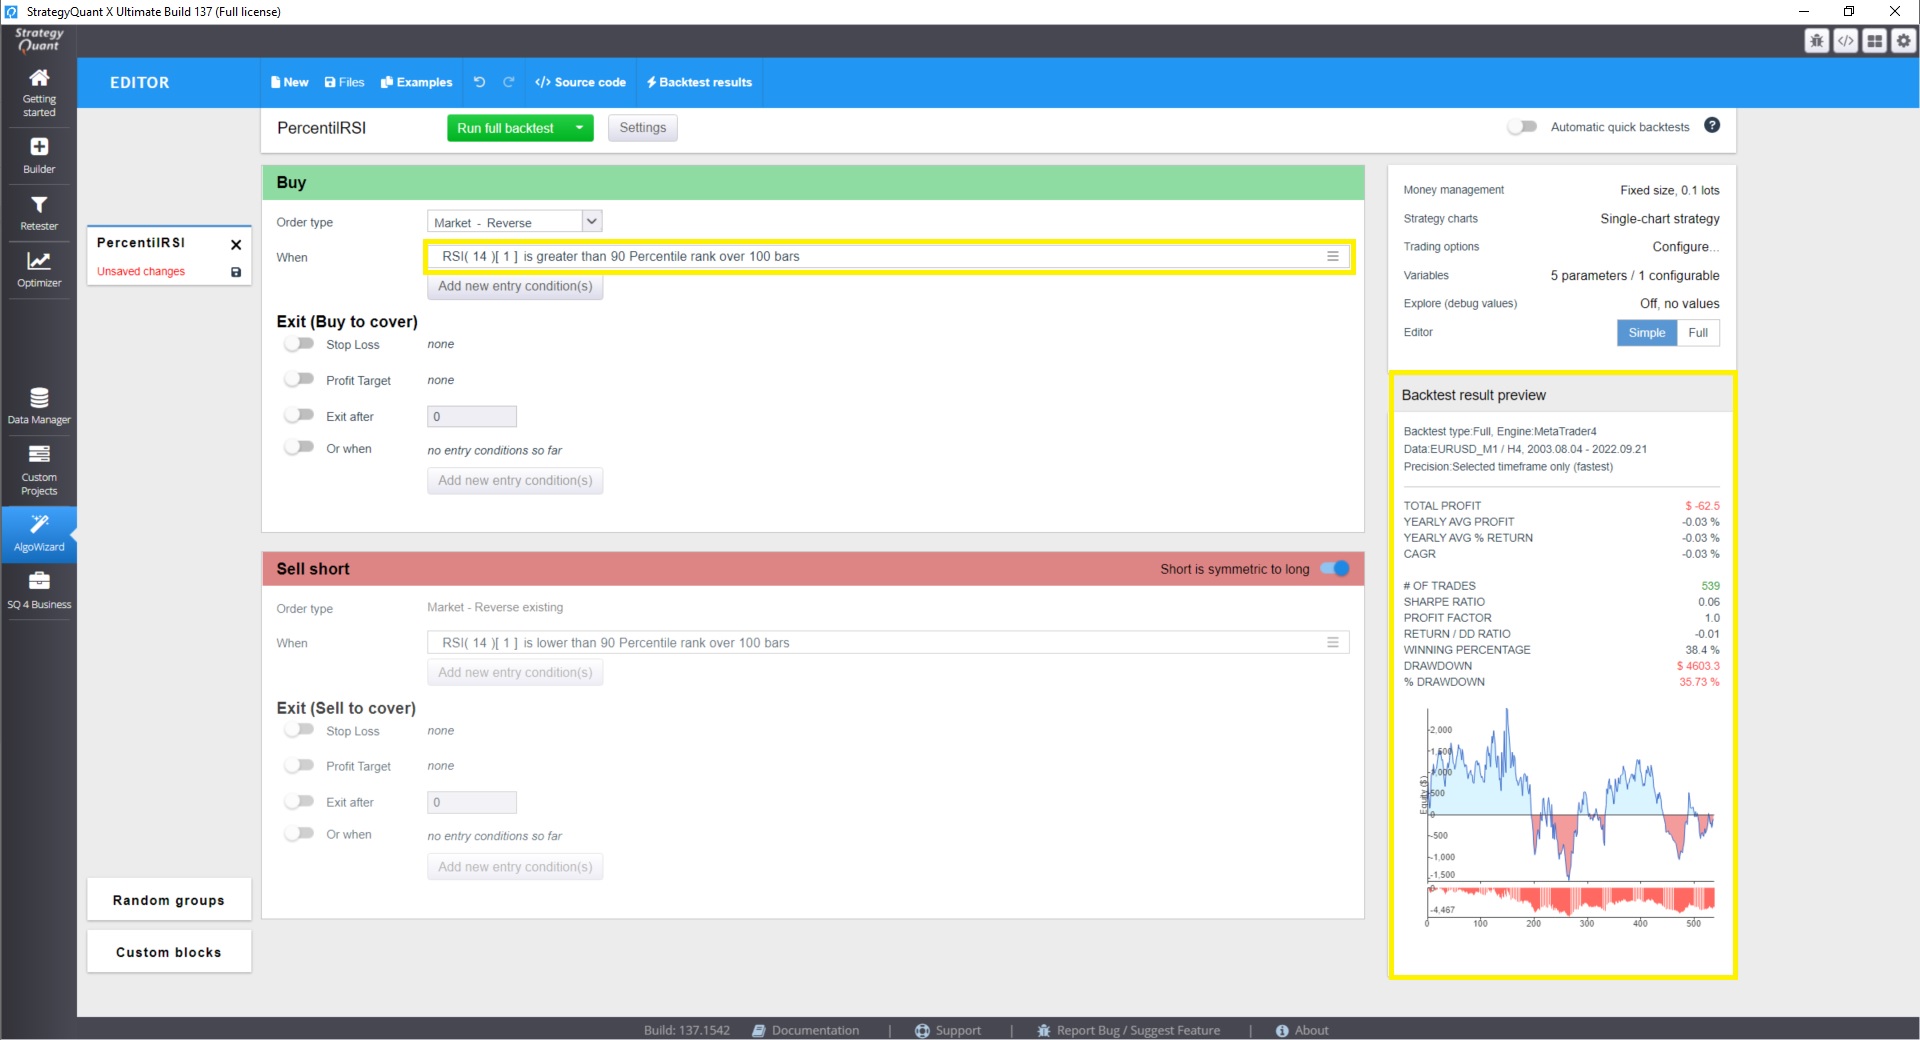
You can use these new comparison blocks to directly construct strategies that might look like this example:
Just choose new comparison block and in Algowizard
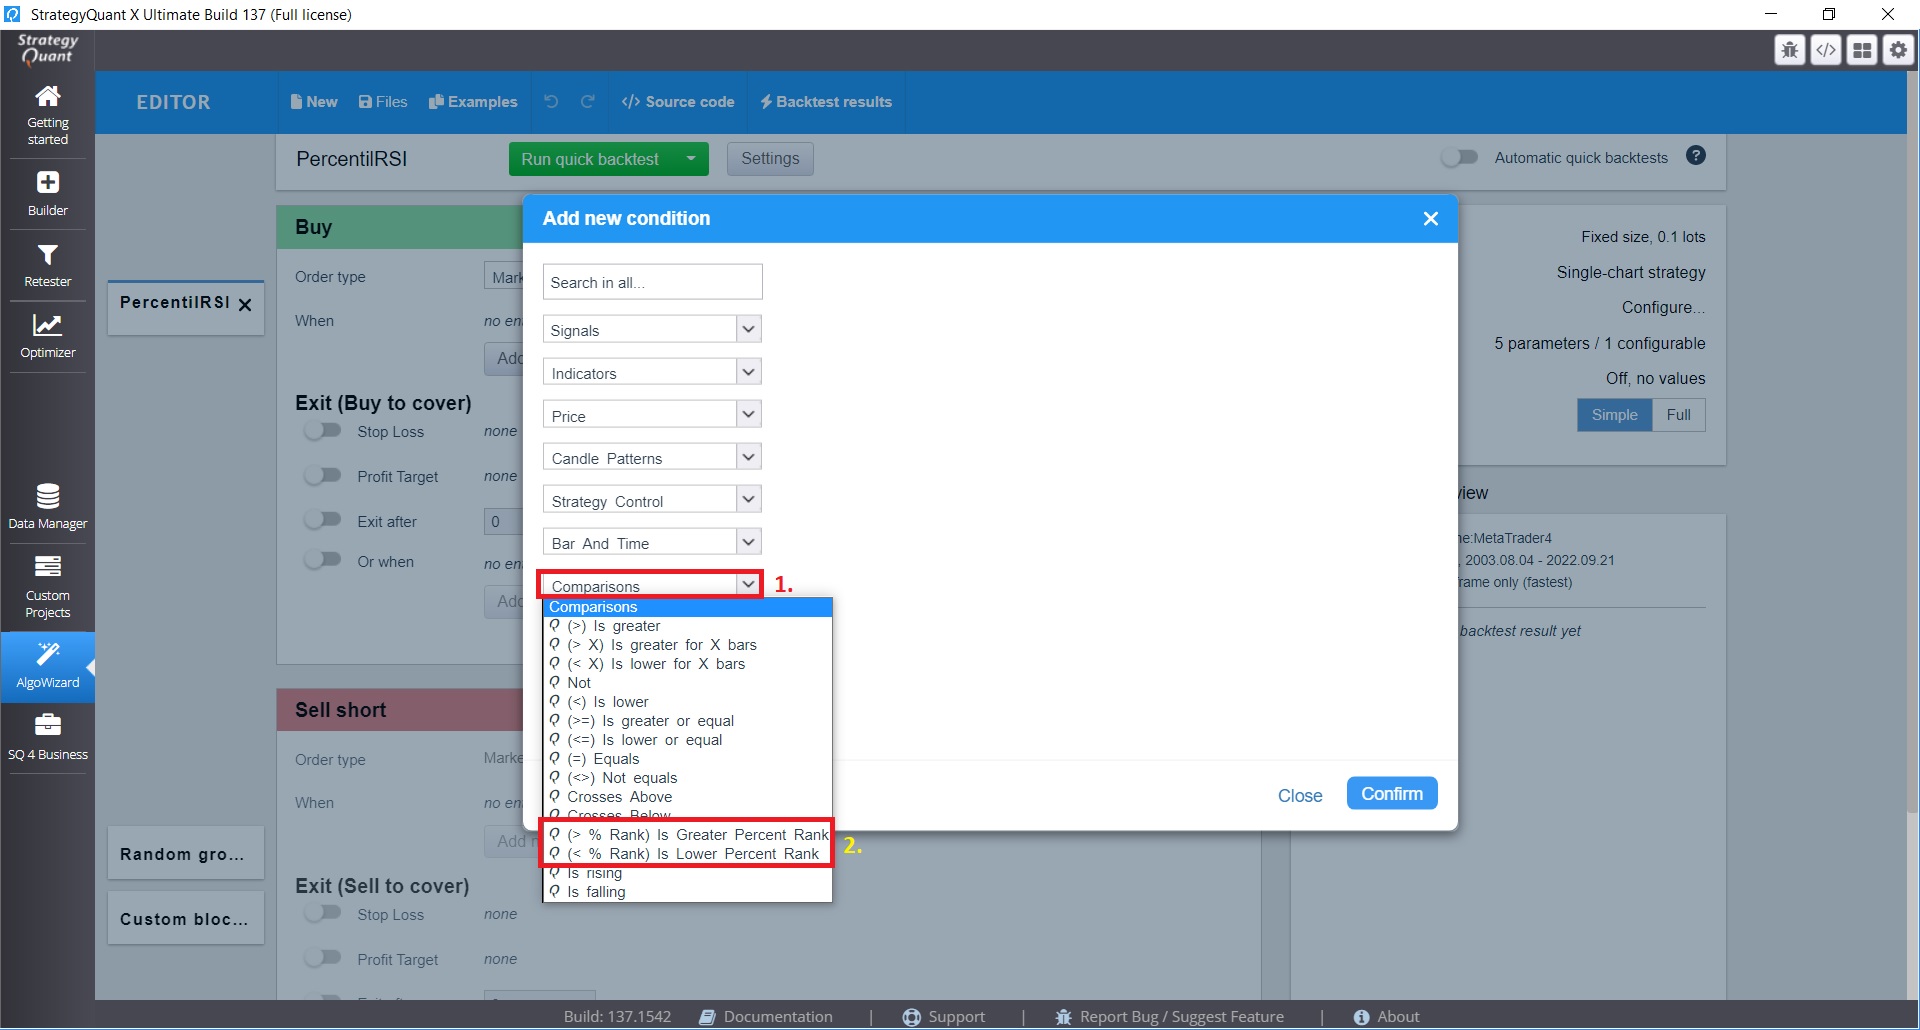
Set parameters of this comparison block
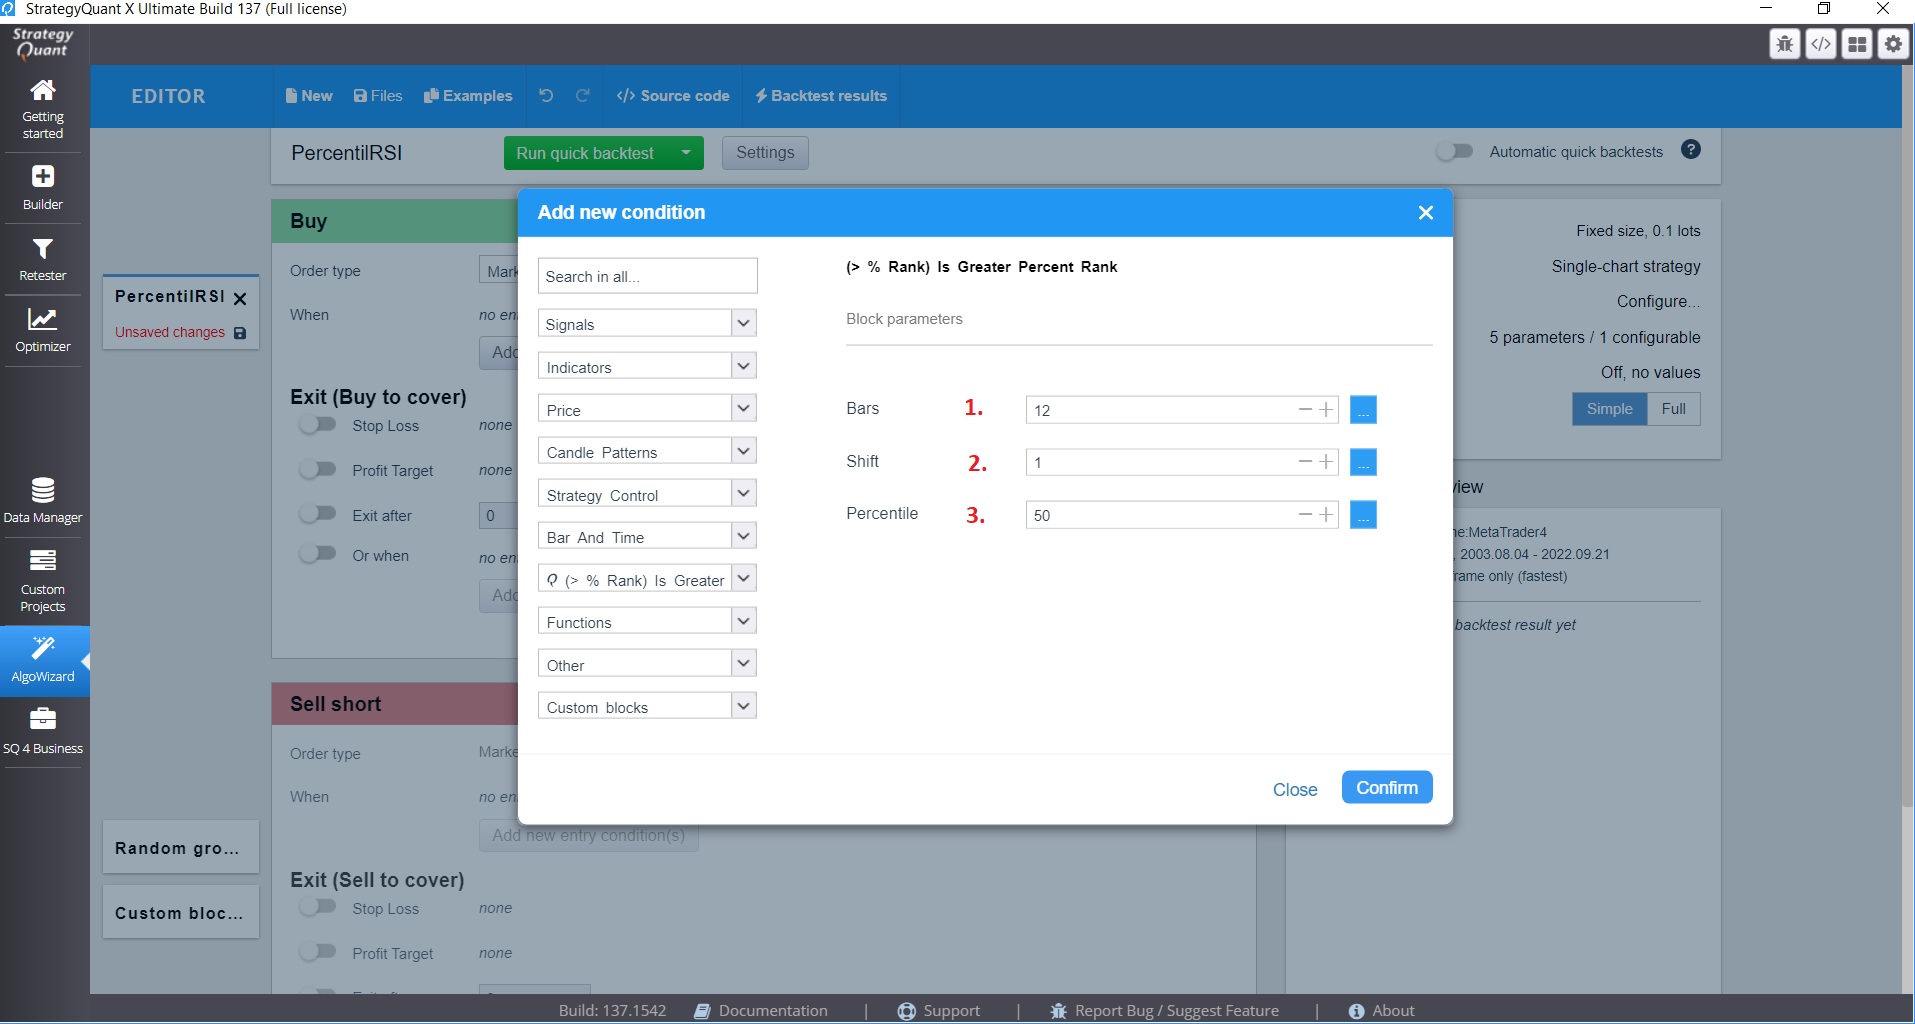
Parameters
- Bar =Number of bar in the past used in calculation of percentile rank
- Shift = – Shift of Data Series
- Percentile Value = Value of percentile above must last value of the indicator
After the initial setup you will see the template for this comparison block
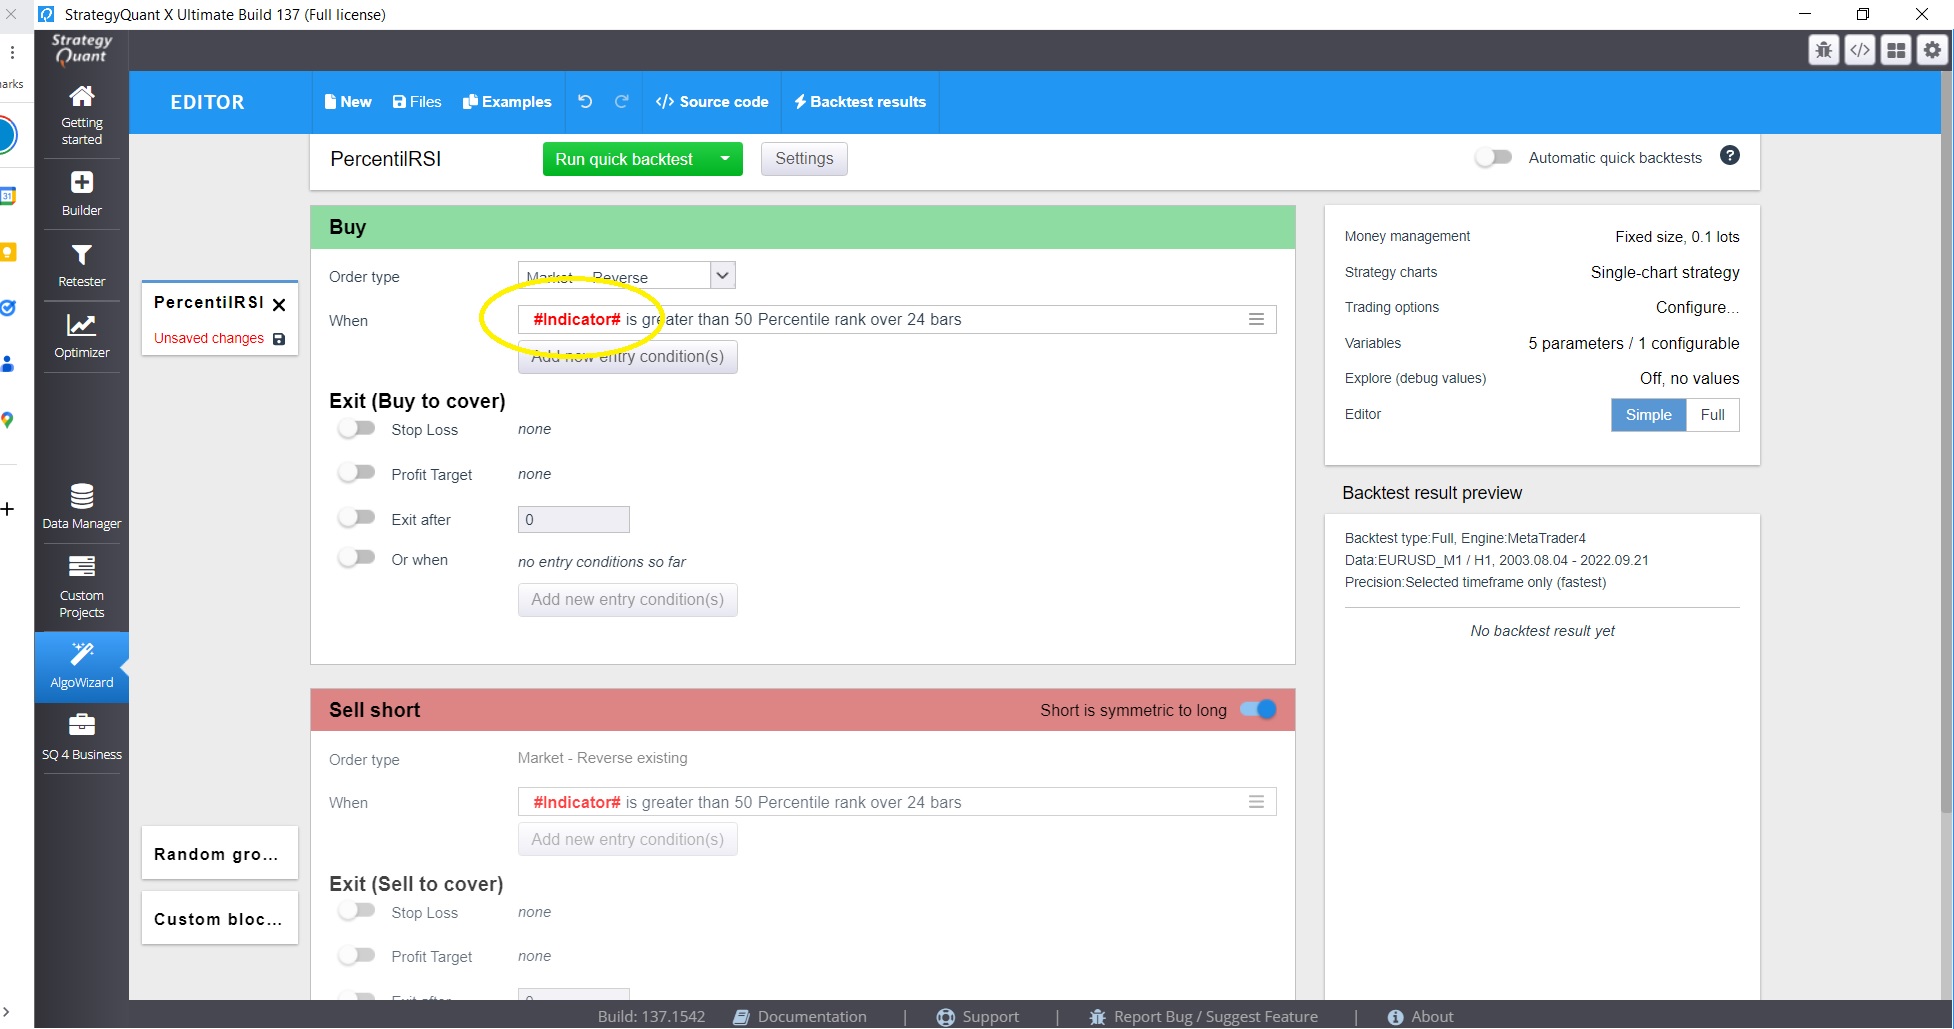
And finally you have to click in #Indicator# and select your indicator. In this case we select RSI indicator…
2. Algowizard – Custom blocks – Creating Conditions
What are Custom blocks?
Custom blocks allow you to create your own combination of blocks – and store this combination as your own custom block.
What is the advantage of creating your own custom block combinations?
The value lies in decreasing randomness by using signals that make some real sense.
StrategyQuant could generate conditions like this randomly using just blocks CCI and IsLower (<), but the chance of generating MEANINGFUL conditions randomly is small when you consider how many random possibilities there are. Another advantage is that when you use block CCI(Period) is rising, from the outside it has only one Period parameter that will be used in both CCI indicators in the condition. You can extend StrategyQuant by creating your own custom blocks like this by making a snippet in Java code. This is a good way, but not everybody is a programmer.
In the picture belowwe have created two opposite blocks . RSI Percentile Long and RSI Percentile Short.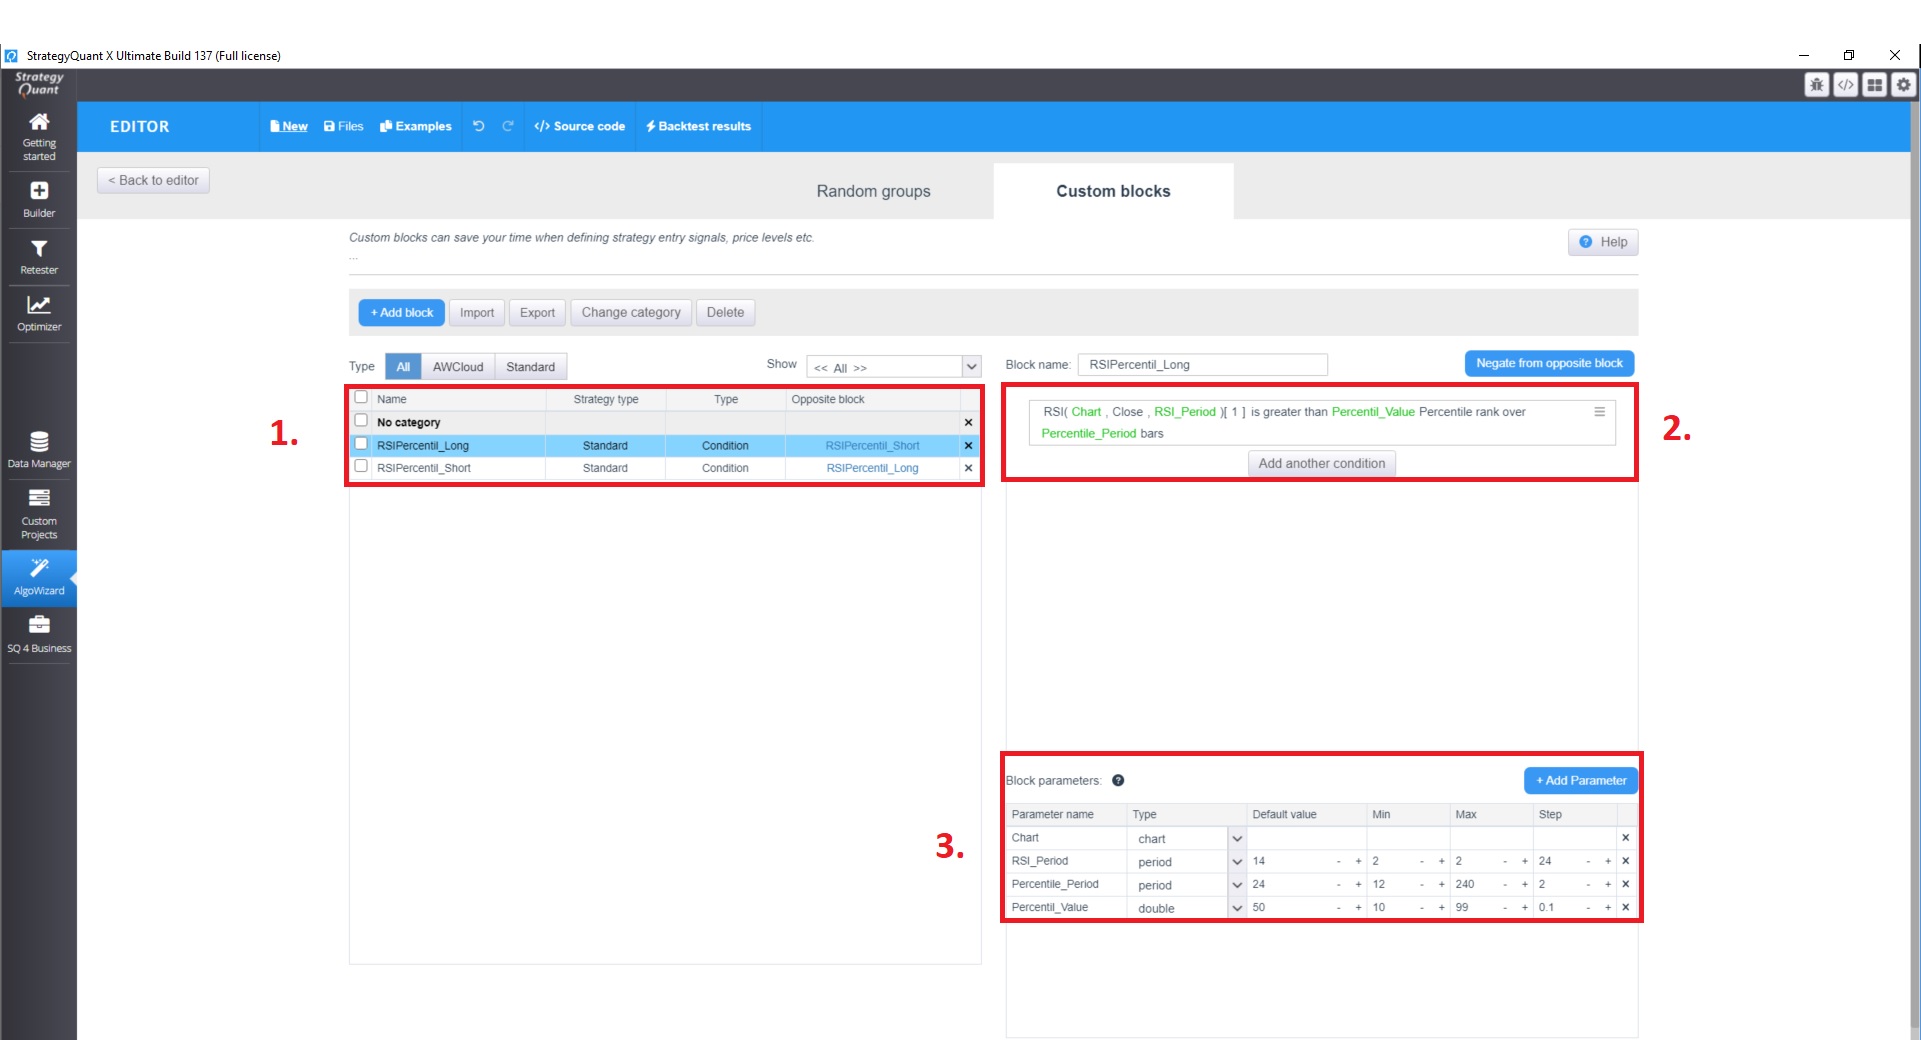
The advantage of custom blocks is the ability to create a condition that you can later use when generating strategies or in Algowizard. We can create simple or combined blocks made of multiple conditions that can be used in random groups You can also customize the parameters of the comparison block and the indicator in it.
So for example you can make Strategy Quant search RSI with period from 2 to 24, a percentile period of 12 to 240 bars into history . And the percentile is searched in the range of 1 to 99 with a dot 0.1
You can find more about constructing Custom block in this documentation material https://strategyquant.com/doc/strategyquant/custom-blocks/
3. Builder – Strategy Generation
In the Builder, you can either use the custom blocks created in the conditions, or you can use Strategy Quant X to find strategies using the genetic search function. It is important to note that setting up the builder requires knowledge and time. I recommend using a setting other than the default for the lower block percentile. The default setting is to search 1000 bars in history and search percentile values from 0.1-99.9 and step 0.1. I use a search of 120 bars in history and a setting or percentiles 1-99 with step 1.
How to use comparison block in builder
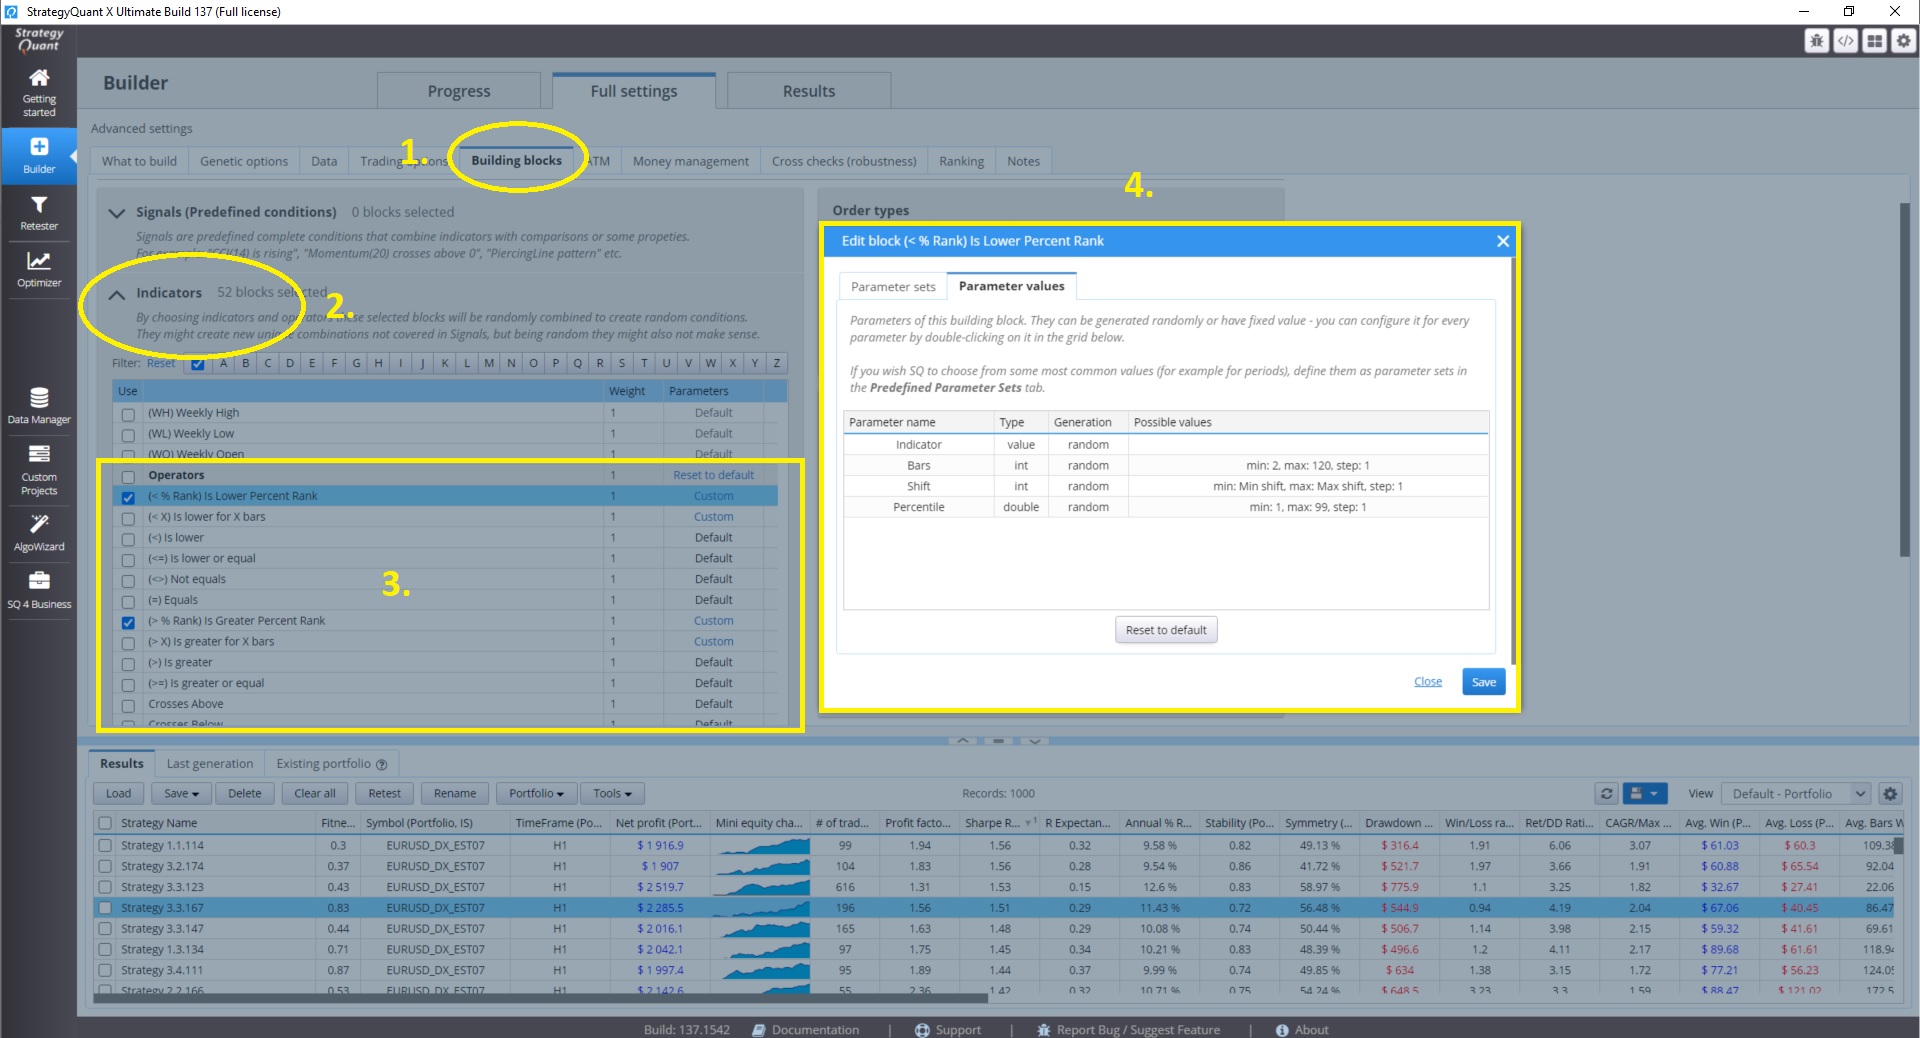
To select a comparison block, click Building Block ( 1 ) , select the indicator menu ( 2 ). You can set the parameters of the comparison block by clicking on default in the right part of the window ( 3 ) and you can change them by selecting the parameter values ( 4 ), where you can set the Bars period And the Percentile value min / max / step in which the genetic engine Strategyquant X will find the strategy blocks.
Summary
Create your own blocks reduce randomness in strategy creation. Percentile comparison blocks are a fairly robust solution for creating entirely new types of blocks
In the following article, I will compare the performance of percentile blocks and traditional blocks on traditional oscillators that are part of StrategyQuantX but both localized on a common server. In the next article, we will present the specific Builder settings that will allow us to create a profitable system built on this new comparison block.
We also plan to introduce other composition blocks that will improve the use of StrategyQuant X.
I hope you found this blog post informative and enjoyable to read! If you have any questions, comments, or suggestions, please don’t hesitate to contact me. I would love to hear from you and continue the conversation.
You can reach me by leaving a comment below, or by sending me an email at [email protected] , or on Discord server here where you can reach me under nickname Clonex (SQX Programming). I’ll do my best to respond as quickly as possible.
Thank you for taking the time to read this post. I appreciate your support and interest in my work. Don’t forget to subscribe to my blog to stay up-to-date on my latest posts and news.
Looking forward to hearing from you soon!

 Tomas Vanek

Thank you so much cloneX I really appreciate this article/guidelines
Awesome as always Clonex, this is awesome to normalize any indicator!
The article is very good but the images have such a low resolution that they are practically useless.
Hi Guelucho. I have updated the images to a higher resolution.
Hey Guys, this text is duplicated in this article:
“ It is expressed as a percentage, indicating the percentage of values in the set that are equal to or less than the value in question. For example, if a value has a percentile rank of 80, it means that 80% of the values in the set are equal to or less than that value.“