In this article I would like to discuss an important part of real algotrading, which is running trading strategies on a live account. This topic is valid for literally every algotrader, not only those who use platform like StrategyQuant for their trading. Applying techniques presented in this article will give you better look on how your trading robots are behaving in real conditions and at least but not last improve you trading results.
Comparing to other trading approaches algotrading offers you possibility of having a detailed view what is happening with your trading robots. You can monitor every trade and order on unlimited number of trading instruments at the same time. The question is how to get the most out of this advantage. As many of you might already experience, the real challenge in algotrading is not where to collect information and data but how to evaluate them and obtain real outputs for your real trading. So, let’s start.
The life cycle of algo-trading portfolio
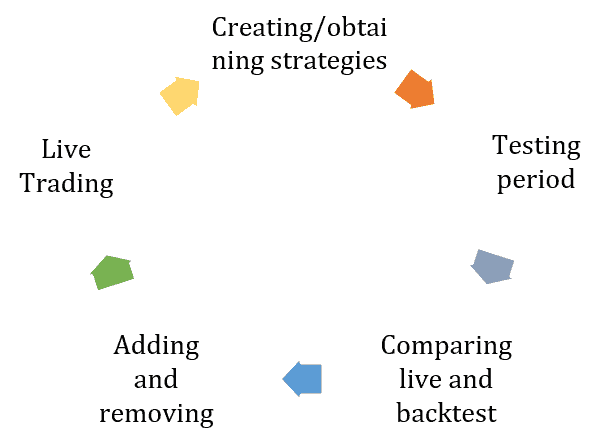
Lifecycle of Algo-trading portfolio
Whenever you are programming your trading robots or using a strategy builder for creating them your algotrading lifecycle will look like on the image above. Everything starts with obtaining portfolio of trading robots. Some of you might using just one robot but I strongly discourage you from this. The real edge in algotrading comes with diversification achieve by using multiple robots. But portfolio composition is not the content of this topic.
What’s the next step? You need to prove your strategies on real market. Even if you create strategy using the best way possible, you might still be facing some issues when it comes to opening real trades. Testing period will reveal these inconsistencies and you will get a better picture of what you can expect from your strategies. Once you gather some real data, it is time for evaluation which might lead to changes in your portfolio. We will talk how to perform it later in this article. After the evaluation you can trade your portfolio live. Now, let’s move on and discuss live trading evaluation in a more practical way.
A frequently asked question is when is right time to compare live trading results with the backtest. There are basically two moments. The first is at the end of your testing period. It can be three months after you deployed your strategies live.
The second moment is periodical check which you can do regularly once a year.
Monitoring live trading results
Suppose you have just turned on live trading in you trading platform. What should be the next step? You should register your trading account in one online monitoring platfom like FX Blue or MyFxBook. I will use FX Blue in my presentation as it offers an easy access to all necessary statistics. On the image below you can see how to export your live account trading history into a CSV file. We will use this saved report in the further steps of this tutorial.
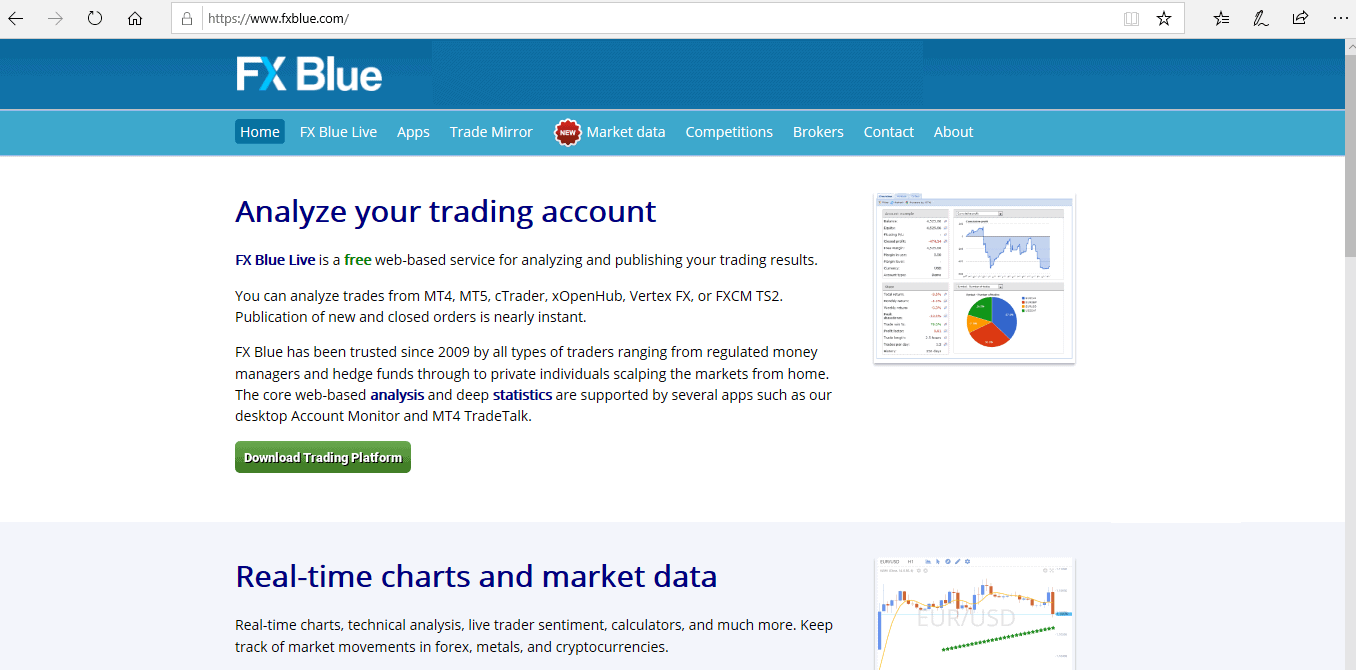
The FxBlue.com free online monitoring platform
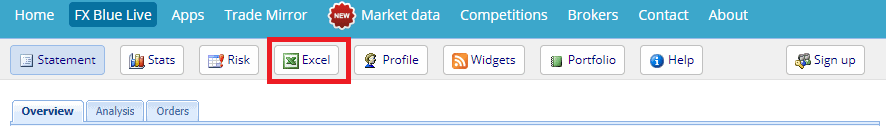
Export of live trading results into a CSV text file
Bulk Comparing of live and backtests results using QuantAnalyzer “Compare results” module
Now let’s get to the core of the article and check how to compare live and backtest results. I will show you how this can be performed in QuantAnalyzer software using “Compare results” module. With this module you can perform a bulk comparison of live strategy results and backtest obtained from multiple sources. I will introduce to you several scenarios.
How this module works?
It allows you to compare multiple results between your trading platform / live results and backtests in StrategyQuant / AlgoWizard.
You can do it also manually by loading each report into QA and then combining it in portfolio, but this new module can do it automatically for you for all files in your folders.
There is a new icon Compare results on the top left
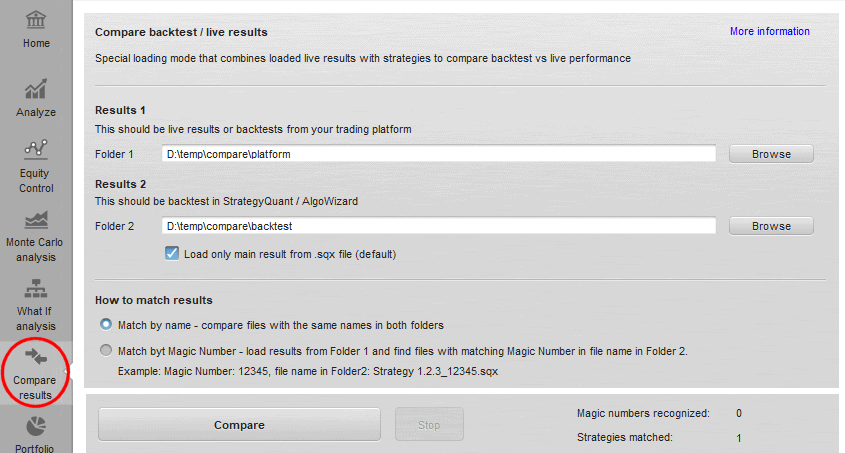
“Compare results” QuantAnalyzer module
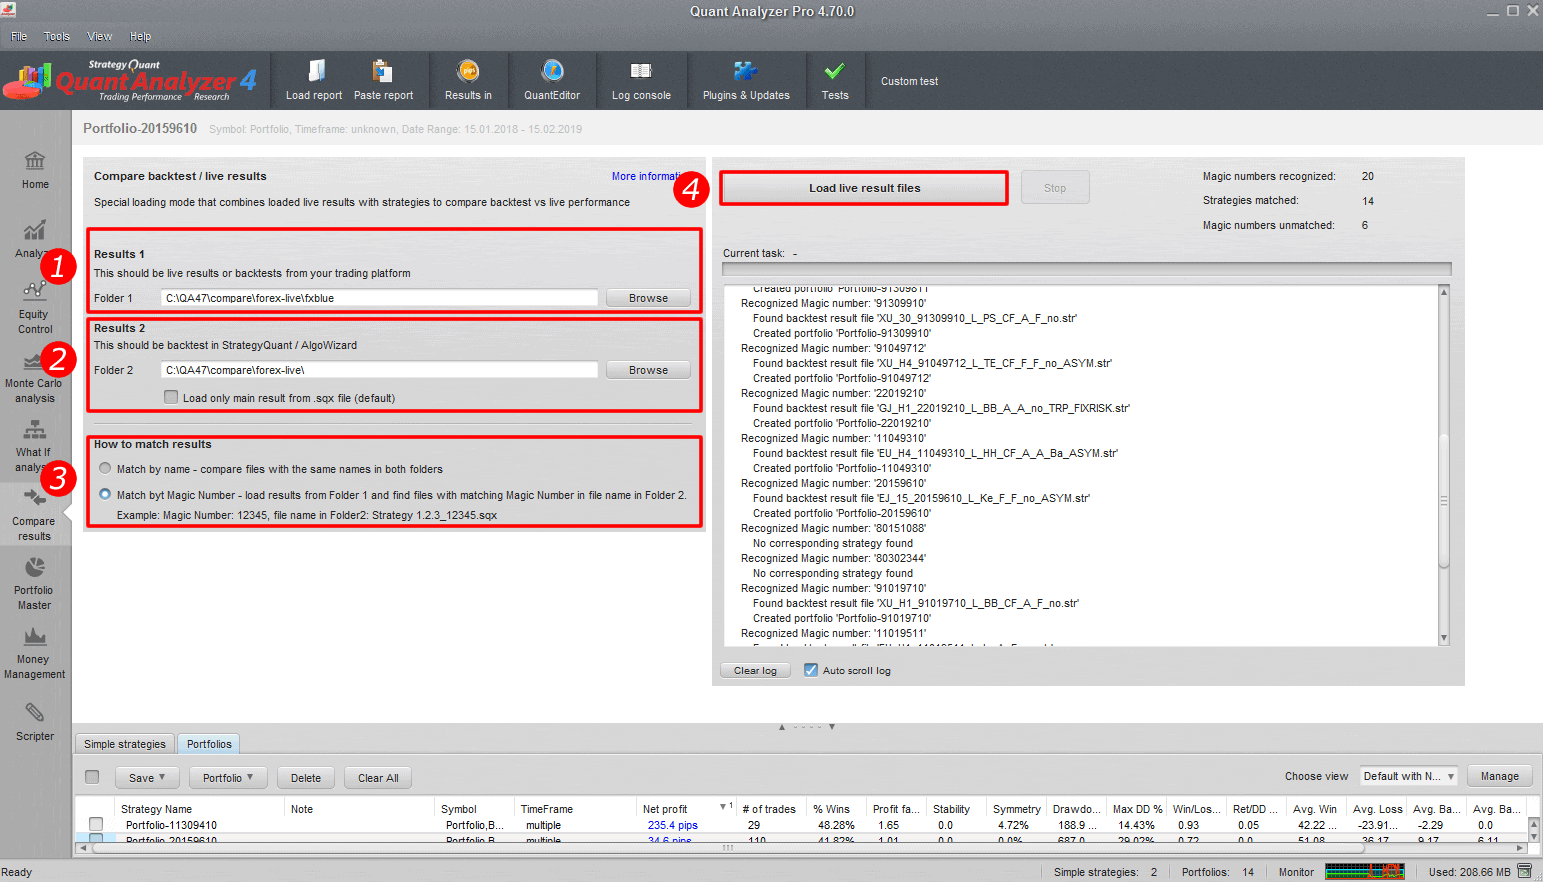
Configuration of the module
Folder 1
folder that contains live results or backtests from your trading platform – Tradestation, MetaTrader, MyFxbook, FxBlue etc.All the formats that QA recognizes are supported
Folder 2
contains backtest of strategies from StrategyQuant / AlgoWizard. It recognizes .sqx and .str format.
Load only main results checkbox”
It is here because the .sqx file can contain multiple results from cross checks or additional markets. They would be loaded together as a portfolio if you uncheck this option. By default it should stay checked.
How to match results
Match by name – means that for every file in Folder 1 it will try to find a file with the same name in Folder 2. When found, these two results are then combined into a portfolio.
Match by Magic Number – can be used when you have reports for example from MyFxbook / FxBlue that contain list of trades for multiple strategies, distinguished by their Magic Number.
With this option it will recognize all Magic numbers from reports loaded from Folder 1, and it will try to find strategies in Folder 2 that have this Magic Number in their name.
So for example if Magic Numbers are 12345, 76543 then it will look for files with strings “12345” and “76543” in their names in Folder 2. If found, it will combine these found results into one portfolio.
Performing result comparison
When you click on Compare button it will perform the comparison and writes the log. All the comparison results are stored into Portfolios databank.
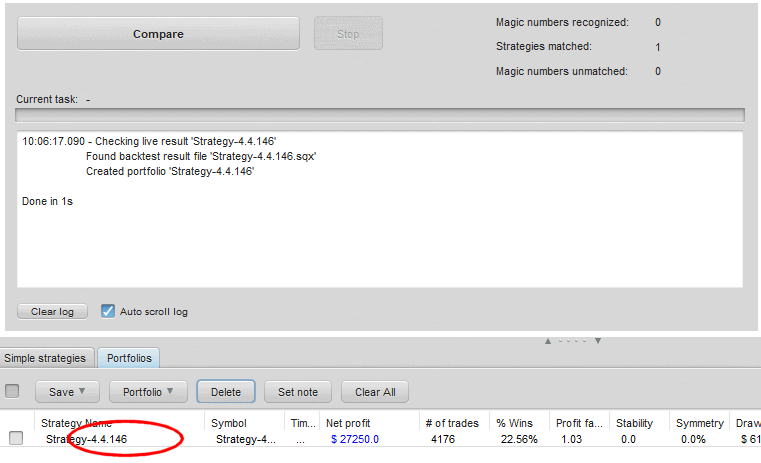
Performing results comparison
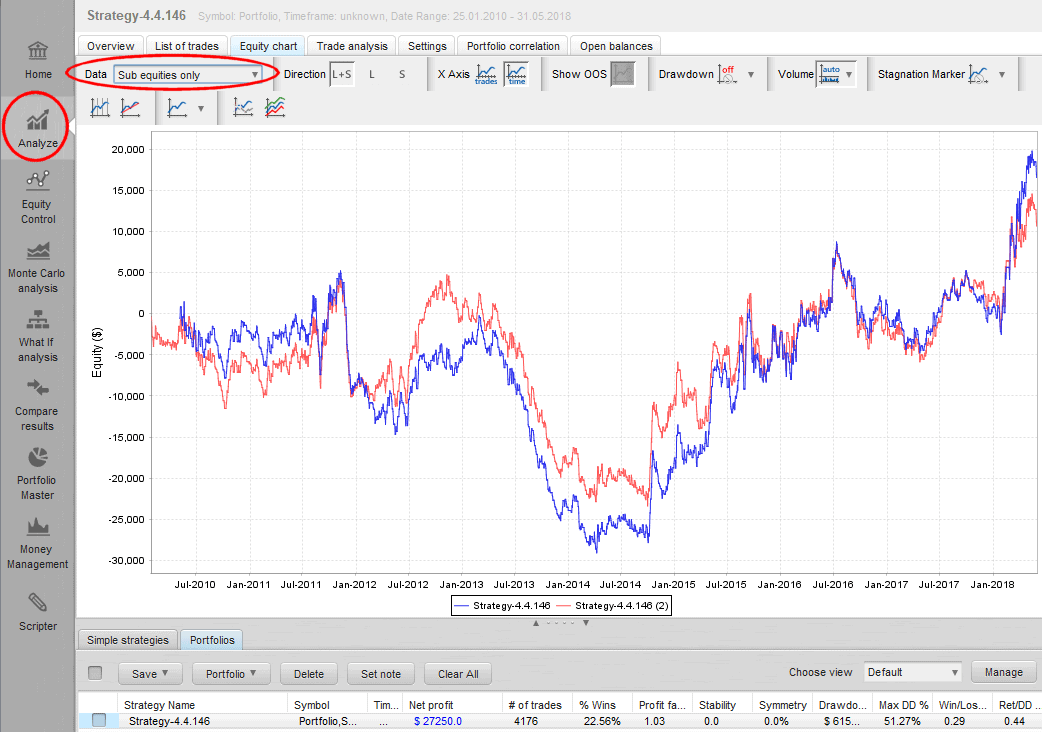
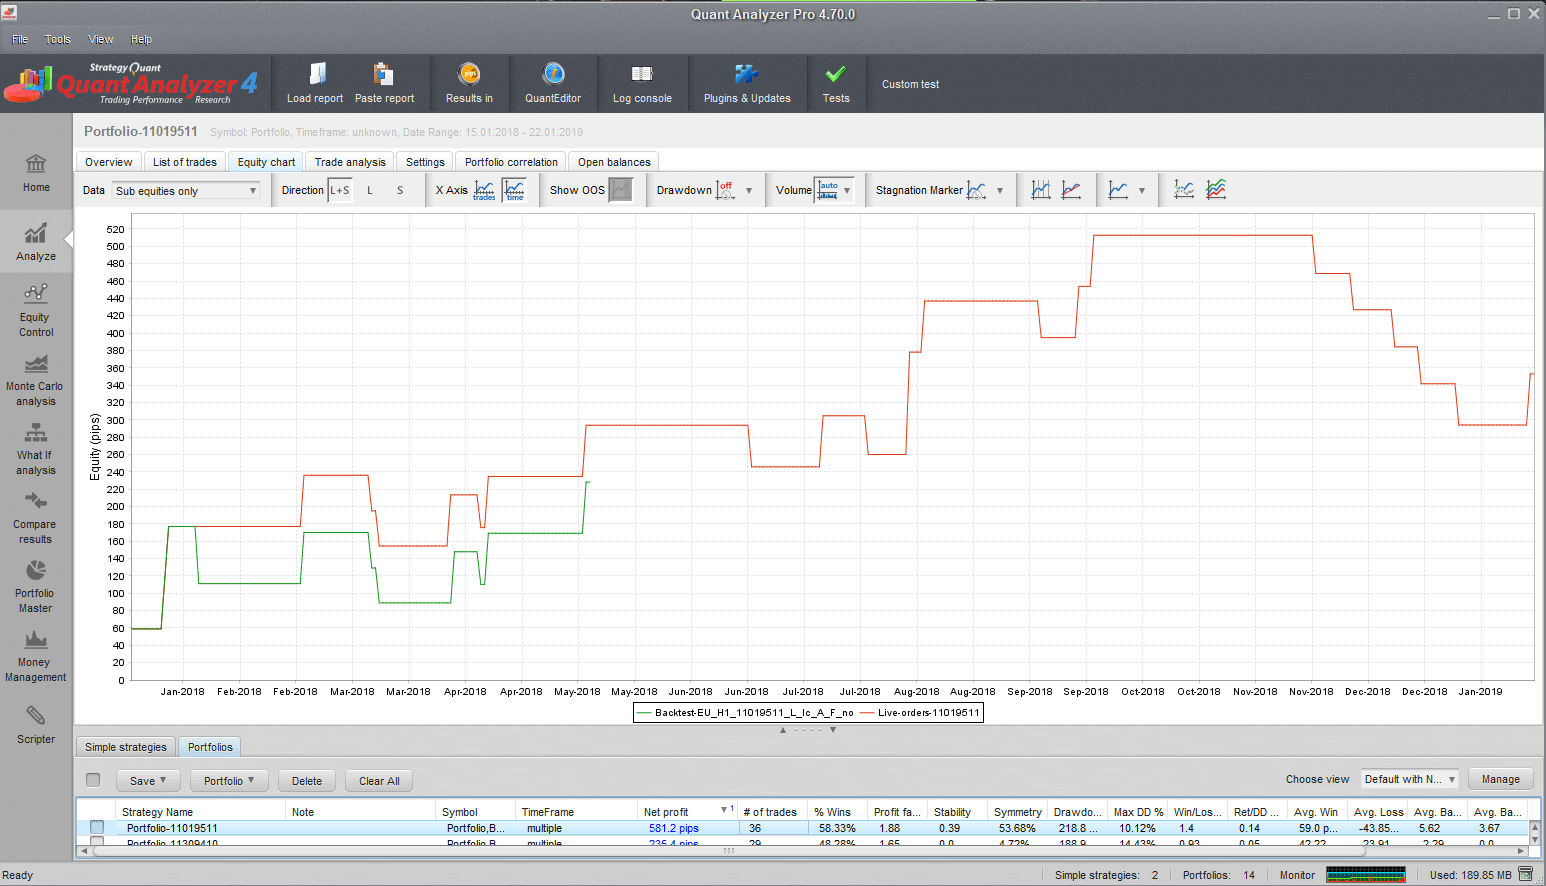
Result comparison graph
In my example I compared backtest of strategy in TradeStation (first blue line) with backtest in StrategyQuant (second, red line). We can see there were some differences in trading but the equities are quite close to each other.
Tip 1: Setting symbol definition during importing report
It might happen that when you load report into QuantAnalyzer then it doesn’t recognize some of symbols which you trade on your account. This might be because many brokers use their own symbol syntax or simply it is not defined in QuantAnalyzer setting file. I will show you how to define all symbols at once in the QuantAnalyzer setting file.
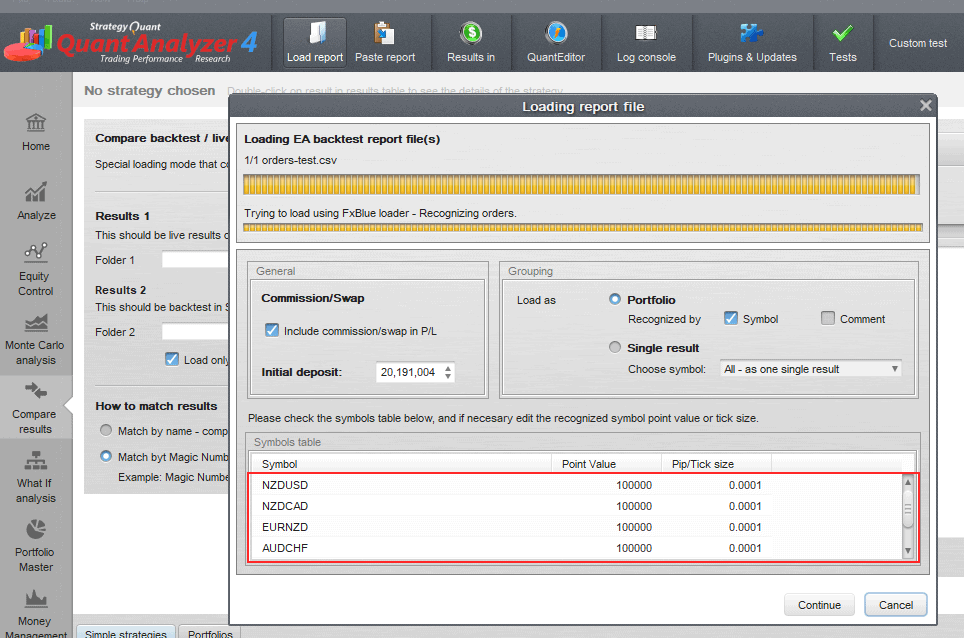
Matching symbol’s definition in QuantAnalyzer
- Open this file C:\QuantAnalyzer47\settings\ PredefinedSymbols.csv in notepad
- Add a new line with your instrument settings at the end of the configuration file.
Example:
30;DE.30;25;1;0.1
FDE30;FDE30;25;1;0.1
ES;ES;50;0.25;0.25
- Save changes and restart QuantAnalyzer
Tip2: Switch results to show them in pips
For correct comparison of results you have to switch results presentation from money to pips.
Switch presentation of results from „money“ to „pips“
Examples of different result comparison scenarios
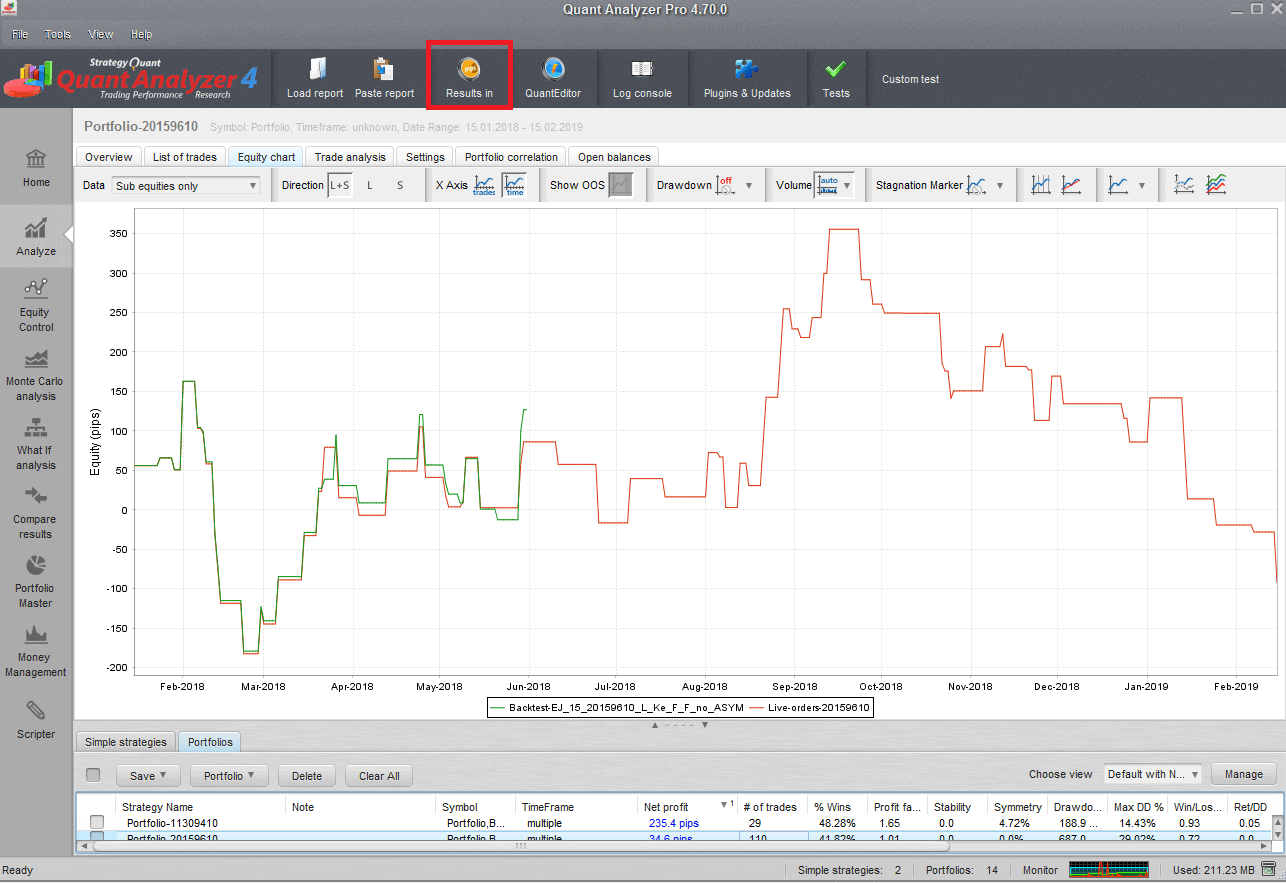
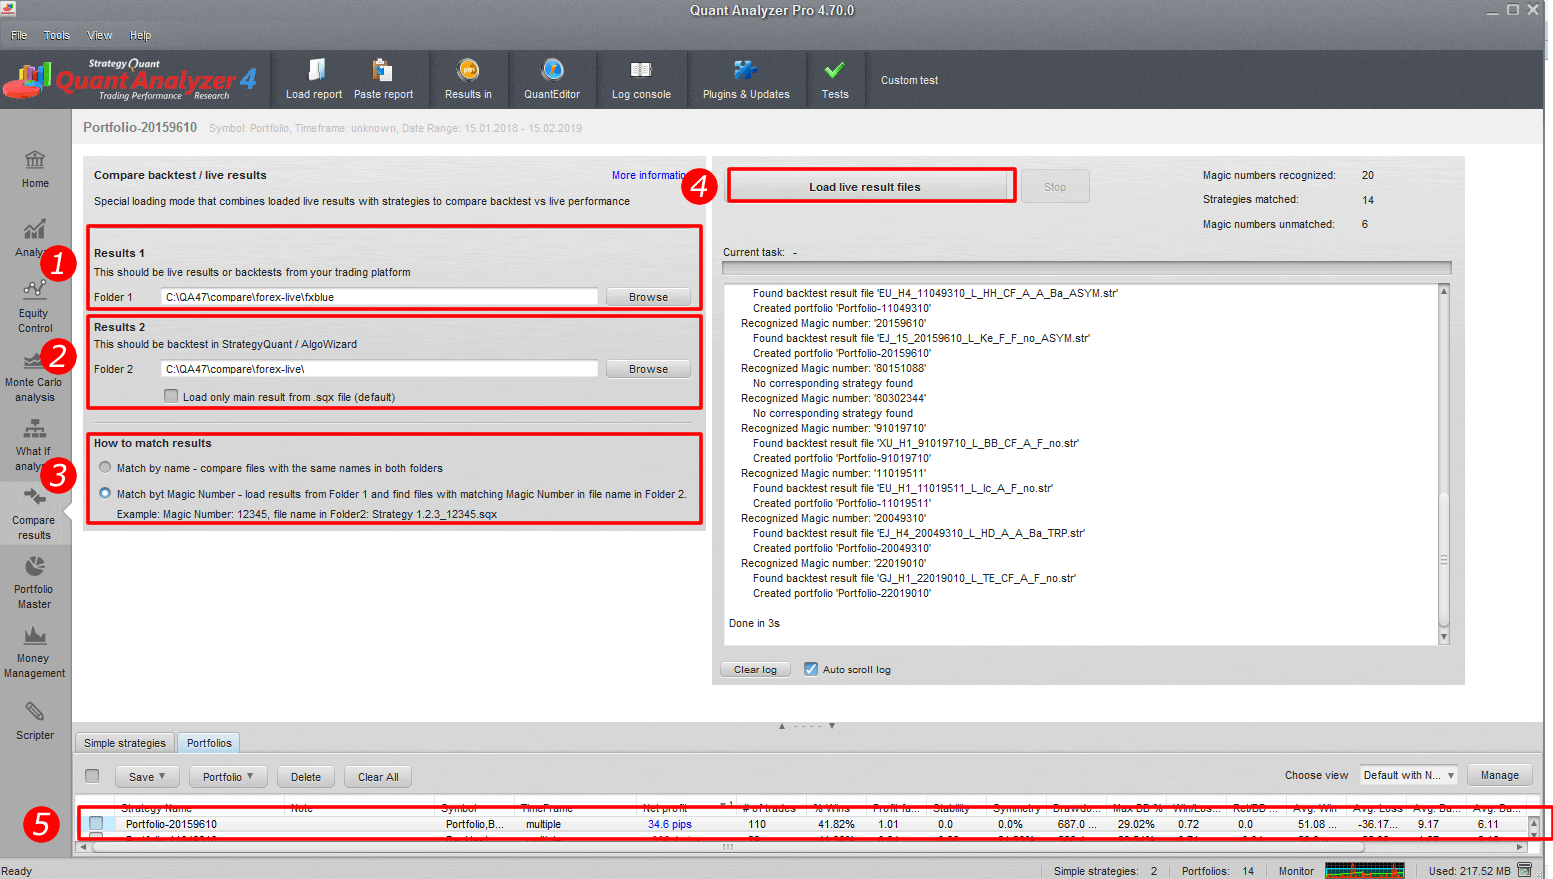
Scenario 1: Compare fxblue live data with StrategyQuant X
This is the most common scenario for the traders who are using StrategyQuant for creating strategies.
- Set path to the folder with fxblue results file (Discussed in “Monitoring live trading results” chapter)
- Set path to the folder with backtests
- Set matching by magic number
- Click on load live result
- double-click on result in databank
Compare fxblue live data with StrategyQuant X
Comparison graph: Green line is backtest and red line is result from FxBlue. You can see that backtest is quite short comparing to the live results. Regarding Live/BT accuracy results matches well
Scenario 2: Compare Metatrader 4 backtest data with FxBlue
You will utilize the second scenario in case that you have trading robot in MT4/MT5 code and you can perform backtest in MetaTrader. Just one note. The most of brokers do not provide long enough historical data for the trading symbols. If you would like to access longer history for free then you can test our free QuantDataManager product. But let’s continue with comparison. Steps are similar to the previous scenario:
- Select FX blue report
- Select MT4 report
- Set comparing by magic number or backtest name
- Click on Load live results files.
Comparing MT4/5 and FxBlue results
On the image you can see that results fit almost perfectly
Other scenarios
TradeStation users can load their TradeStation live report and compare with strategies generated in StrategyQuant X. You can also compare MT4 backtest results with StrategyQuant X results. There numerous ways how to use this module.
Comparison results interpretation – When to stop trading strategy?
Now it is time to discuss how interpret the results. When is the right time to stop trading the strategy?
Real trading always involves slippages, spikes etc.. Therefore, real results will be usually slightly worse than the backtest. What we should focus on is how much backtest trades match with the real one. For example, if 80% of trades are similar, then it is confirming the quality of the strategy. If the backtest and real results significantly differ then we should stop trading this strategy, as there is some discrepancy in the execution of the logic of the strategy.
On the image below you can see live results deviation from the backtest. If the situation marked by red rectangle has happen during the testing period then I would stop trading the strategy.
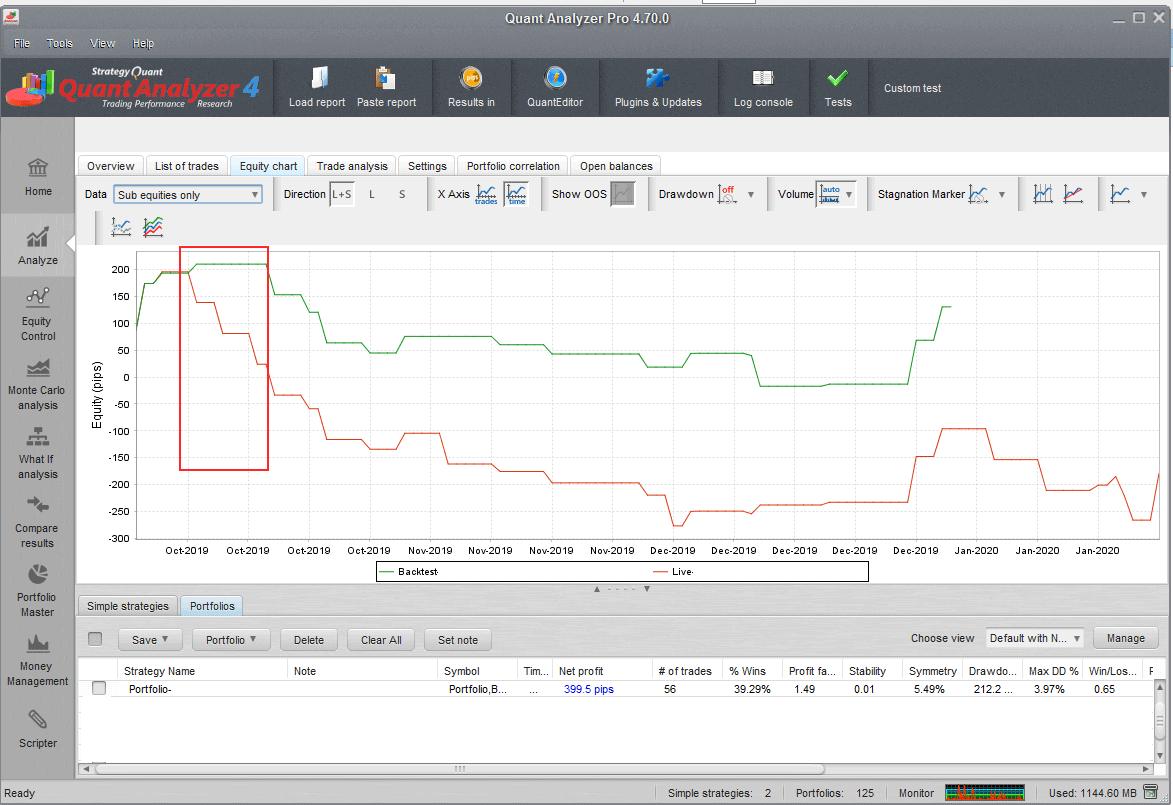
Real-backtest results mismatch
How to evaluate live performance comparing to backtest?
Beside result match there is one more aspect which we need to evaluate during live trading and especially while evaluating testing period. And it is live performance comparing to backtest. In this case you can easily take overall profit of the trading symbol e.g. EURUS and compare it with the backtest. You can for example find out that real performance is 70% of the backtest. For me everything between 70-100% is fine as live conditions are more though than the ideal backtest. But if real performance will be 30% of the backtest performance then we need to perform further research and find a reason of this inconsistency. It can be for example lack of liquidity on the symbol which leads to big slippages.
Conclusion
When I started my algotrading path several years ago, there was a lack of methodology and tools to evaluate live results. With my friends I hired programmer to create a custom solution for our team. I am glad that now this software is available for everyone with wide range of supported platforms. I focused in this article on practical examples as well as on rules how to evaluate results during live trading. Having good rules will help you to make clear decision during your lifetime of portfolio and will allow you to be more consistent with your results.

 Tomas Vanek

Looks promising! I see this is part of version 4.7, when do you expect this version to be released?