Introduction
The ATR (Average True Range) Trailing Stops indicator is a powerful and dynamic tool that can help traders manage risk and optimize their trading strategies. By effectively using this indicator, traders can better time their entries and exits, while protecting their profits and minimizing losses. In this article, we will explore how to use the ATR Trailing Stops indicator and discuss the optimal situations for its application.
The ATR Trailing Stops indicator is a combination of the ATR (Average True Range) and a trailing stop. The Average True Range is a volatility measurement that helps traders understand the average range of price movements over a specified period. By combining this information with a trailing stop, traders can dynamically adjust their stop loss levels based on market volatility. This can help them avoid getting stopped out too early due to minor market fluctuations while still protecting their profits.
This application of ATR Trailing Stops provides a method for identifying breakout levels, determining exit points, and can additionally serve as a tool for identifying the current market environment.
How to Set the ATR Trailing Stops Indicator
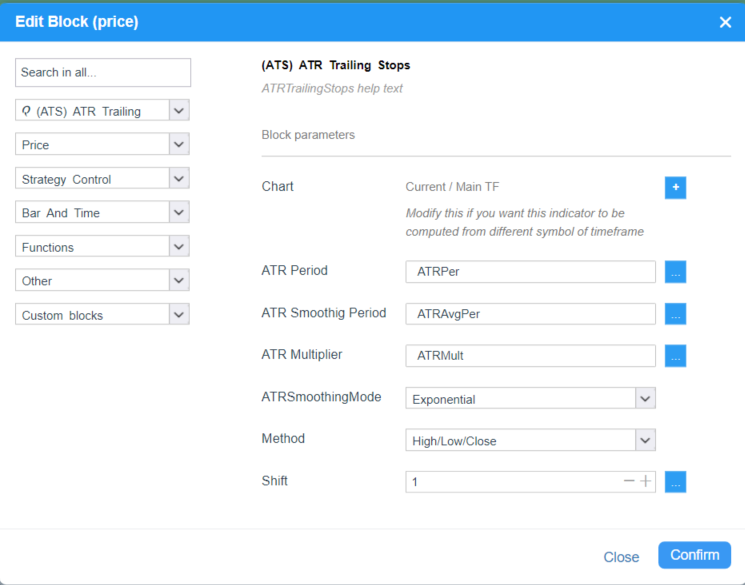
- Set ATR period: The first step in using the ATR Trailing Stops indicator is to determine the period for the ATR calculation. Typically, traders use a 14-bars period, but it can be adjusted depending on the trader’s preferences and the specific market being traded.
- Set ATR Smoothing Period : To obtain a smoother ATR value, calculate the selected moving average of the ATR values over a specified period.
- Set the ATR Multiplier: The ATR multiplier determines how far away the trailing stop will be from the current price. A higher multiplier will result in a wider trailing stop, while a lower multiplier will create a tighter stop. The choice of the ATR multiplier depends on the trader’s risk tolerance and the market’s volatility. A common starting point is to use a multiplier of 2 or 3.
- Set the Type of Moving Average for smoothing: To smooth the ATR, you can use different methods to calculate moving averages: SMA, EMA, SMMA, WMA
- Set Method of Calculation for Trailing Line: The indicator uses 3 calculation methods Close, High/Low, High/Low/Close. Each method has its advantages and disadvantages. I recommend you to look at each method in the chart and test it
ATR Trailing stops settings in Algowizard
When to Use the ATR Trailing Stops Indicator
You can use it as an indicator when to enter or exit a position. This can be achieved through entry methods ( Order Types ) such as “Enter AT Market – Reverse,” “Enter At Market,” as we can see in the picture below.
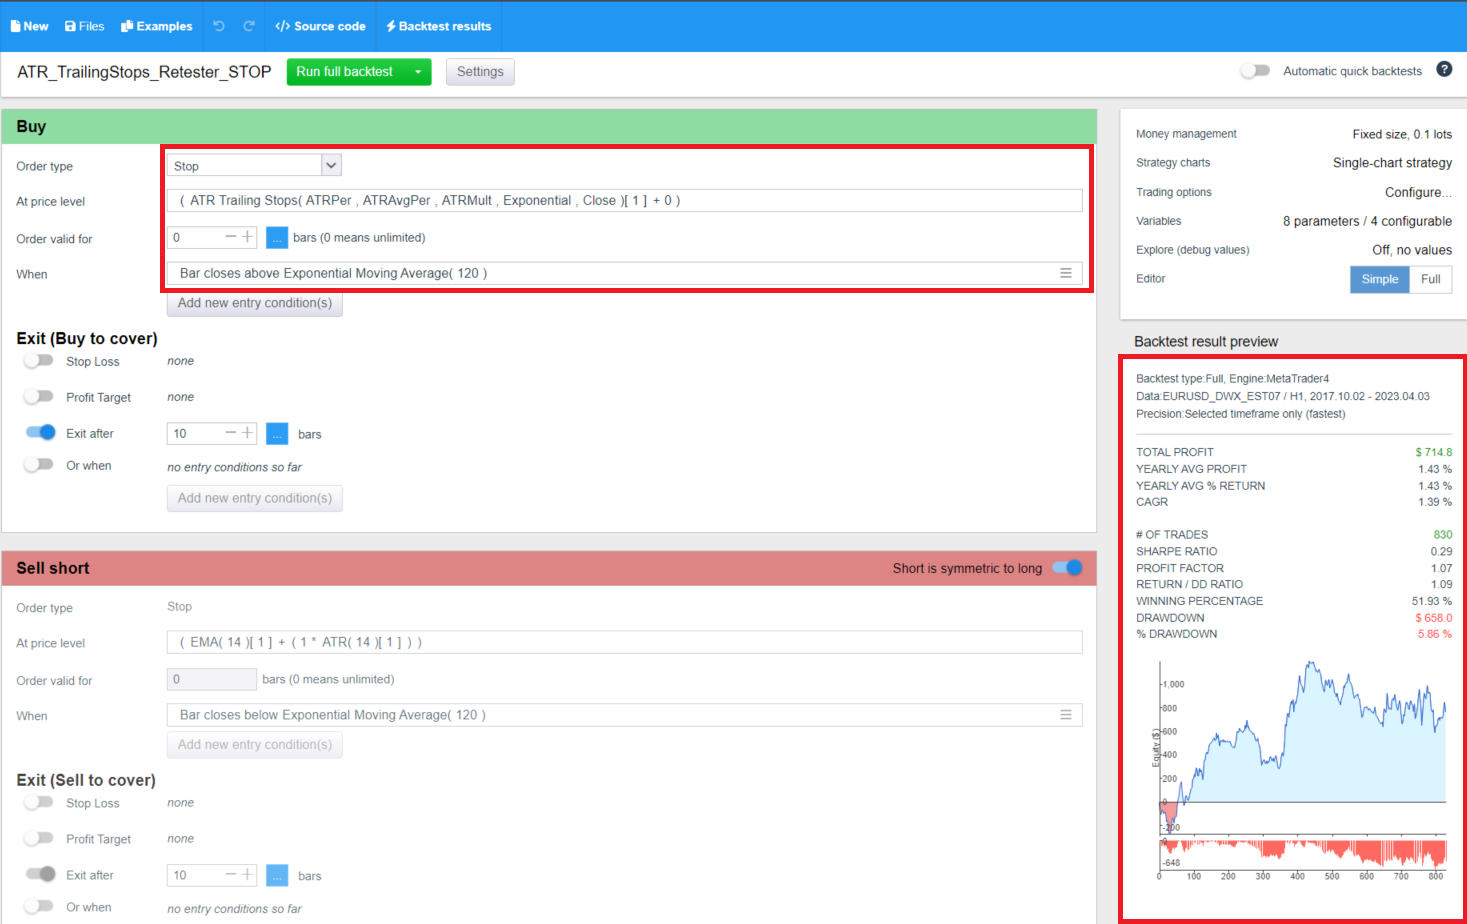
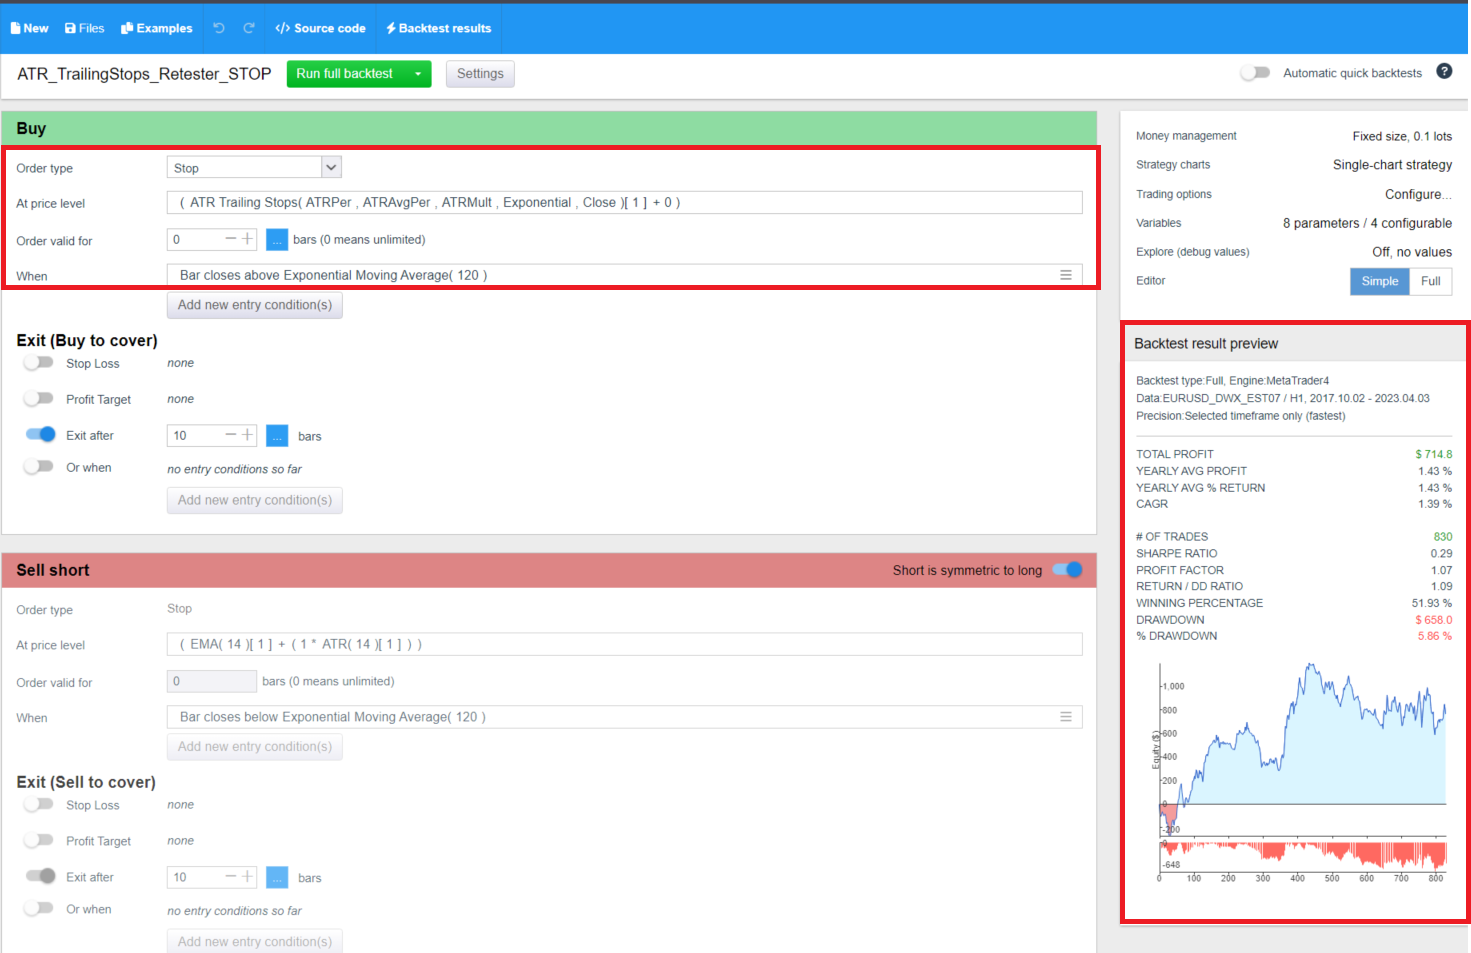
It can be used in conjunction with other indicators when setting the entry level to a position using the Enter At Stop entry method ( Order Types ) as we can see in the picture below.
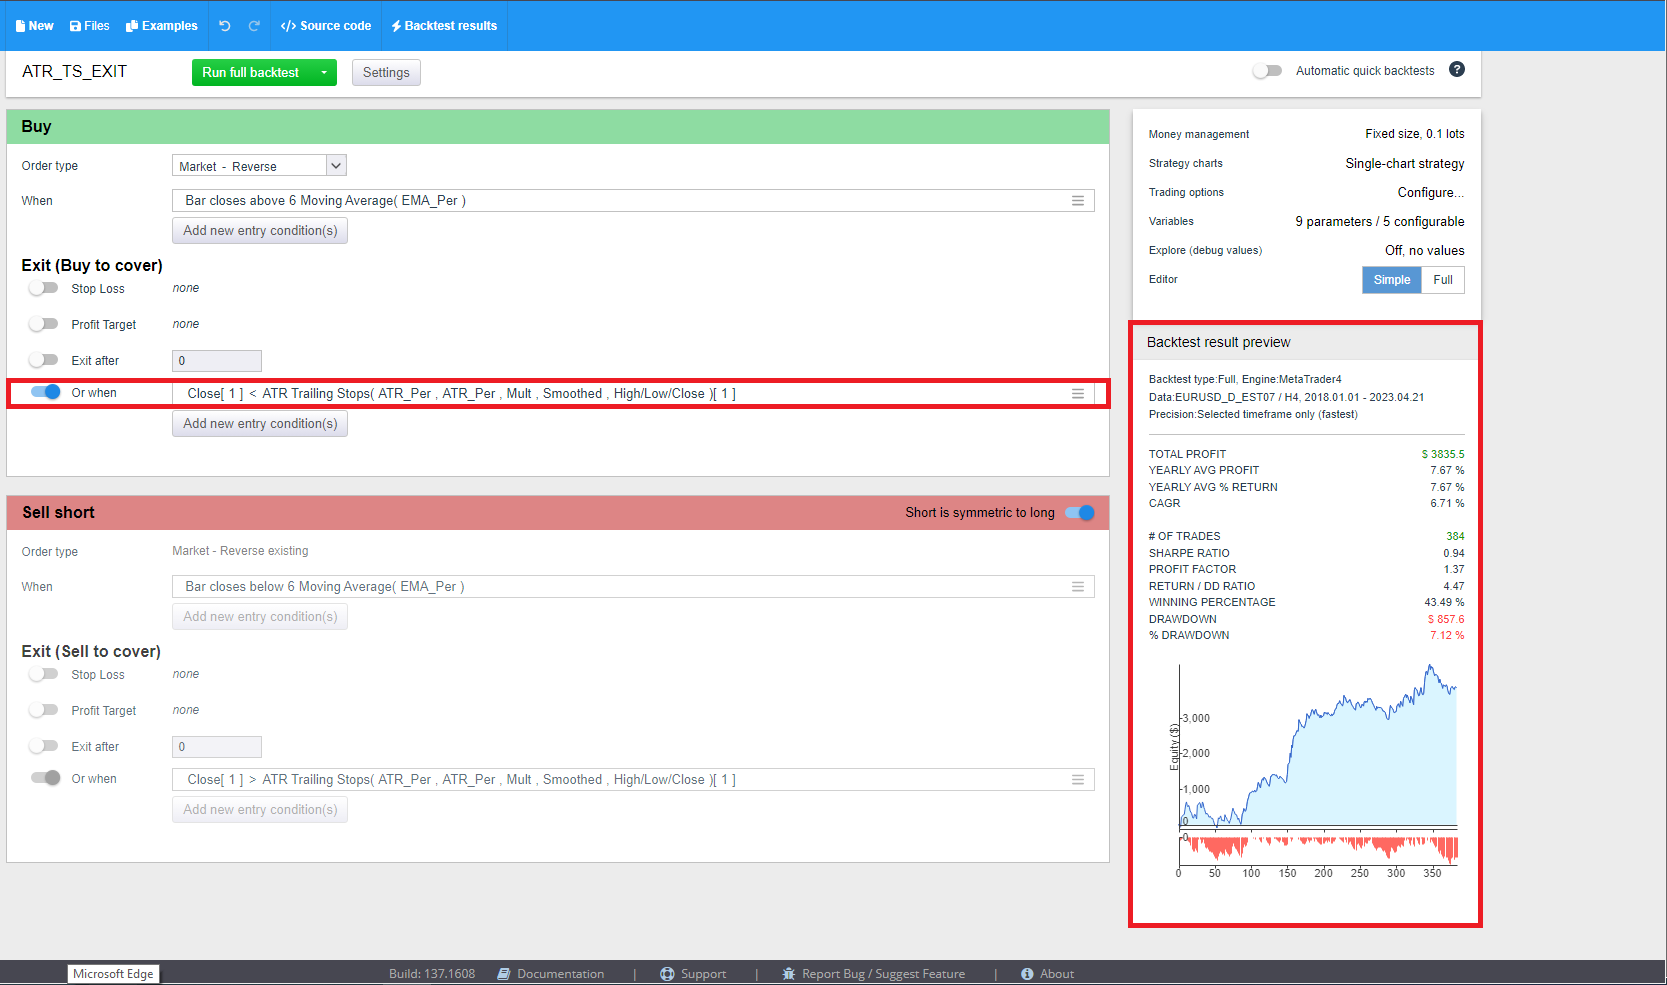
The ATR Trailing Stops indicator can be used in Algowizard as StopLoss to exit the trade as we can see in the picture below.
ATR Trailing Stops can also be used in the builder part of the StrategyQuantX program which uses machine learning techniques and genetic programming to automatically generate new automated systems.
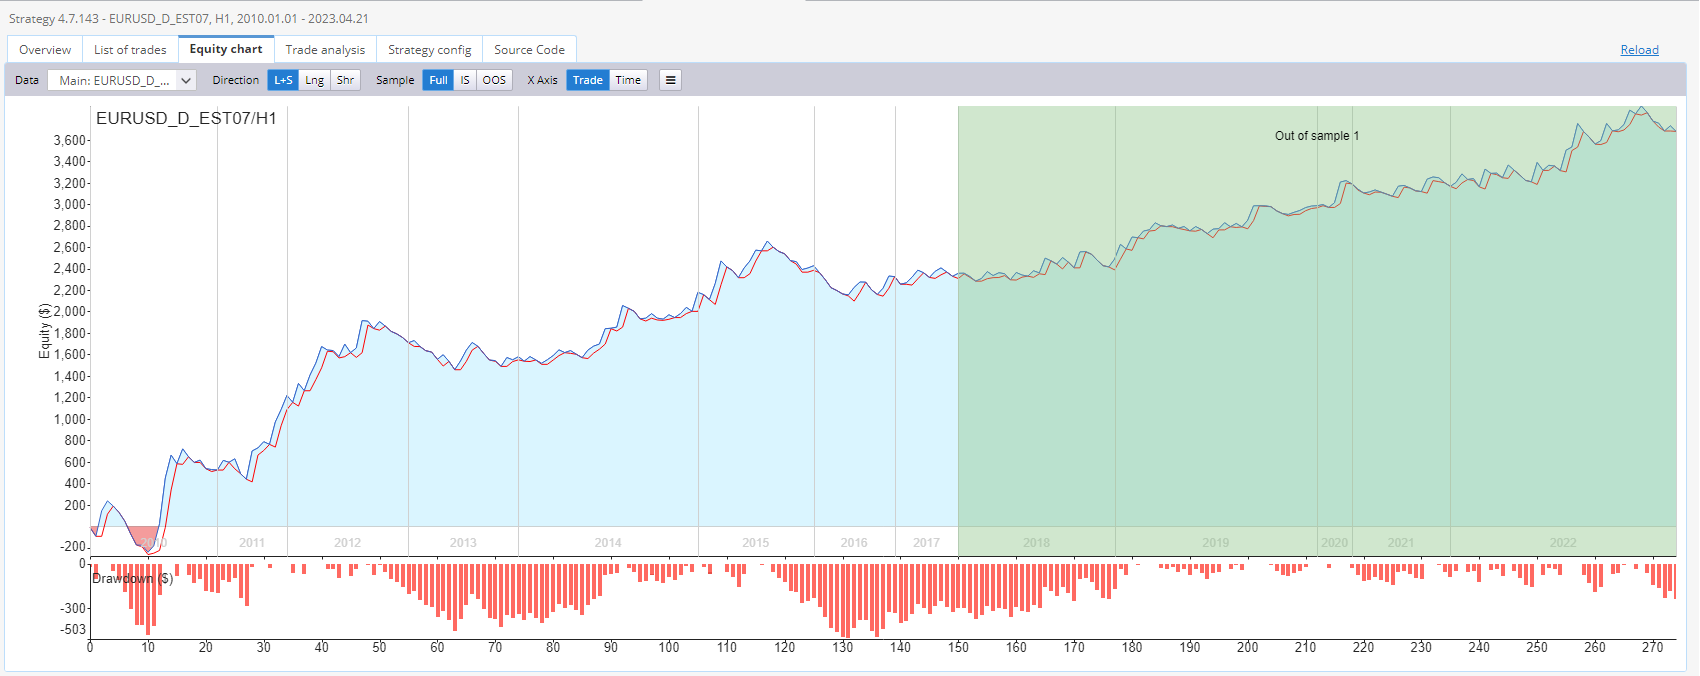
The image provided below showcases the graphical representation of the performance of a particular trading strategy used on the EURUSD 1 Hour Timeframe. This strategy is designed using the ATR Trailing Stop indicator. The equity curve, which is a graphical representation of the profit or loss generated by the strategy over a specific period of time, is used to analyze the performance of the trading system.
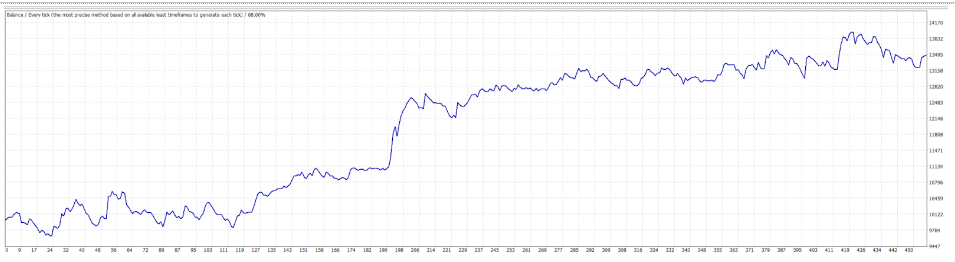
On the picture below is another nice backtest from Metatrader 4 I discovered while developing a strategy for the EURUSD currency pair on the 4-hour time frame using Darwinex data.
Conclusion
The ATR trailing stops indicator are a helpful tool for traders who want to control their risk and improve their trading strategies. By learning how to use this tool and recognising when it can be useful, traders can make better decisions and increase their chances of making profitable trades. You can try different ATR periods, ATR Avg periods, multipliers or calculation methods to find the combination that suits your trading style and the markets you trade.
You can download the indicator here.
Indicator is implemented for: MT4/MT5/Tradestation/ Multicharts
You can easily prepare your conditions as Custom blocks in Algowizard More information you can find here:
In this module, you can also modify the custom blocks – change the periods, change the steps, etc.
How to import custom indicators to SQX:


Has this indicator been properly tested in Tradestation? Just tried to add in TS a strategy generated in sqx which uses it for entries and trades completly mismatched between TS and SQX – although I’m using the same data in both.
Do you mean you normally get a match between results but not with this indicator?
Hi,Yes it was tested. Send me the not working stategy to the: hudec@Kevin.com
How is this different from the Trailing strop in Exity Types apart from Smoothing? When to use one over the other?