Introdução
O indicador ATR (Average True Range) Trailing Stops é uma ferramenta poderosa e dinâmica que pode ajudar os traders a gerenciar riscos e otimizar suas estratégias de negociação. Com o uso eficaz desse indicador, os traders podem cronometrar melhor suas entradas e saídas, protegendo seus lucros e minimizando as perdas. Neste artigo, exploraremos como usar o indicador ATR Trailing Stops e discutiremos as situações ideais para sua aplicação.
O indicador ATR Trailing Stops é uma combinação do ATR (Average True Range) e de um trailing stop. O Average True Range é uma medida de volatilidade que ajuda os traders a entender a faixa média de movimentos de preço em um período específico. Ao combinar essas informações com um trailing stop, os traders podem ajustar dinamicamente seus níveis de stop loss com base na volatilidade do mercado. Isso pode ajudá-los a evitar que sejam interrompidos muito cedo devido a pequenas flutuações do mercado e, ao mesmo tempo, proteger seus lucros.
Essa aplicação de ATR Trailing Stops fornece um método para identificar níveis de ruptura, determinar pontos de saída e pode servir também como uma ferramenta para identificar o ambiente atual do mercado.
Como definir o indicador ATR Trailing Stops
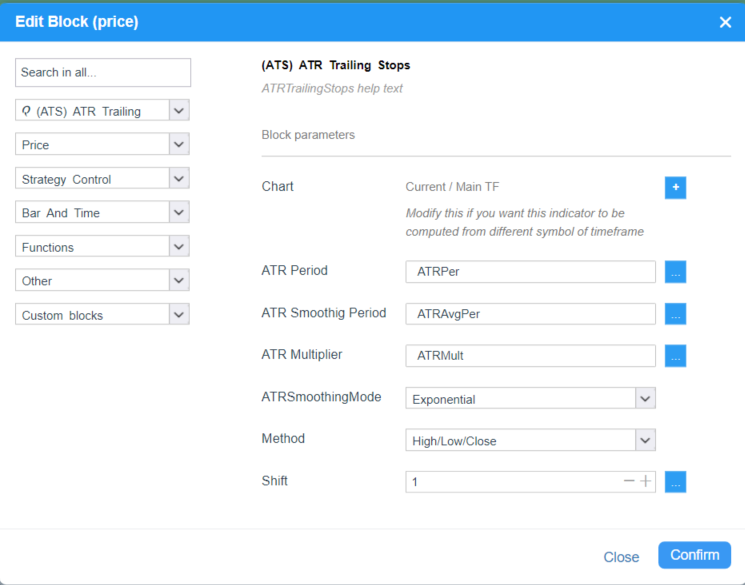
- Definir o período ATR: A primeira etapa para usar o indicador ATR Trailing Stops é determinar o período para o cálculo do ATR. Normalmente, os traders usam um período de 14 barras, mas ele pode ser ajustado dependendo das preferências do trader e do mercado específico que está sendo negociado.
- Definir período de suavização de ATR : Para obter um valor de ATR mais suave, calcule a média móvel selecionada dos valores de ATR em um período especificado.
- Definir o multiplicador de ATR: O multiplicador ATR determina a distância entre o trailing stop e o preço atual. Um multiplicador mais alto resultará em um trailing stop mais amplo, enquanto um multiplicador mais baixo criará um stop mais restrito. A escolha do multiplicador de ATR depende da tolerância ao risco do trader e da volatilidade do mercado. Um ponto de partida comum é usar um multiplicador de 2 ou 3.
- Defina o tipo de média móvel para suavização: Para suavizar o ATR, você pode usar diferentes métodos para calcular as médias móveis: SMA, EMA, SMMA, WMA
- Defina o método de cálculo para a linha de fuga: O indicador usa três métodos de cálculo Fechar, alto/baixo, alto/baixo/fechado. Cada método tem suas vantagens e desvantagens. Recomendo que você observe cada método no gráfico e teste-o
Configurações de ATR Trailing stops no Algowizard
Quando usar o indicador ATR Trailing Stops
Você pode usá-lo como um indicador de quando entrar ou sair de uma posição. Isso pode ser feito por meio de métodos de entrada (tipos de ordem), como "Enter AT Market - Reverse", "Enter At Market", como podemos ver na figura abaixo.
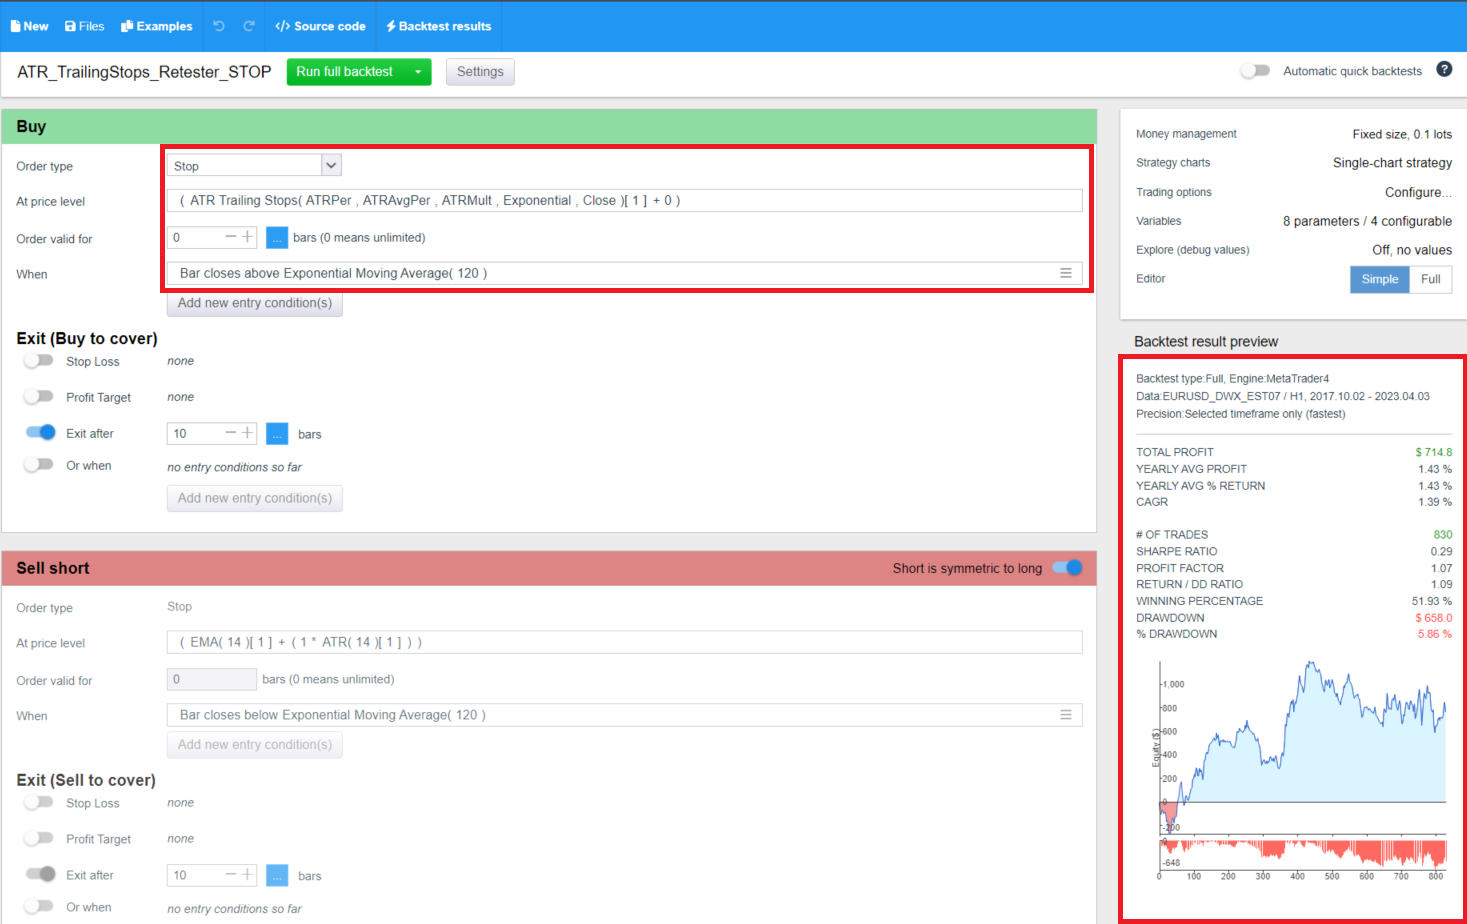
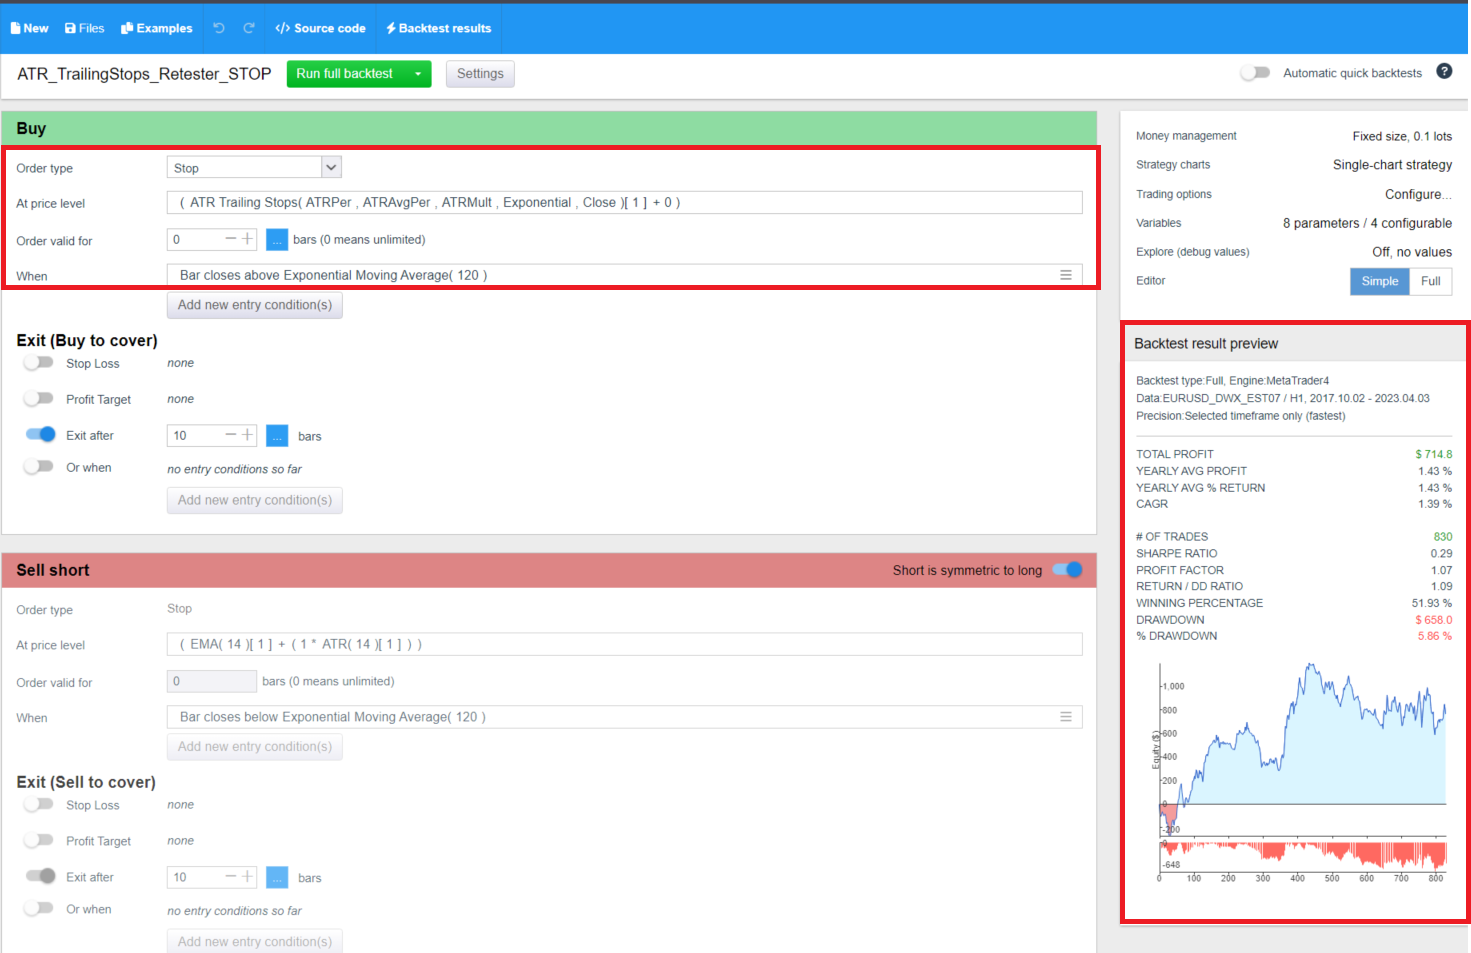
Ele pode ser usado em conjunto com outros indicadores ao definir o nível de entrada para uma posição usando o método de entrada Enter At Stop (Tipos de ordem), como podemos ver na figura abaixo.
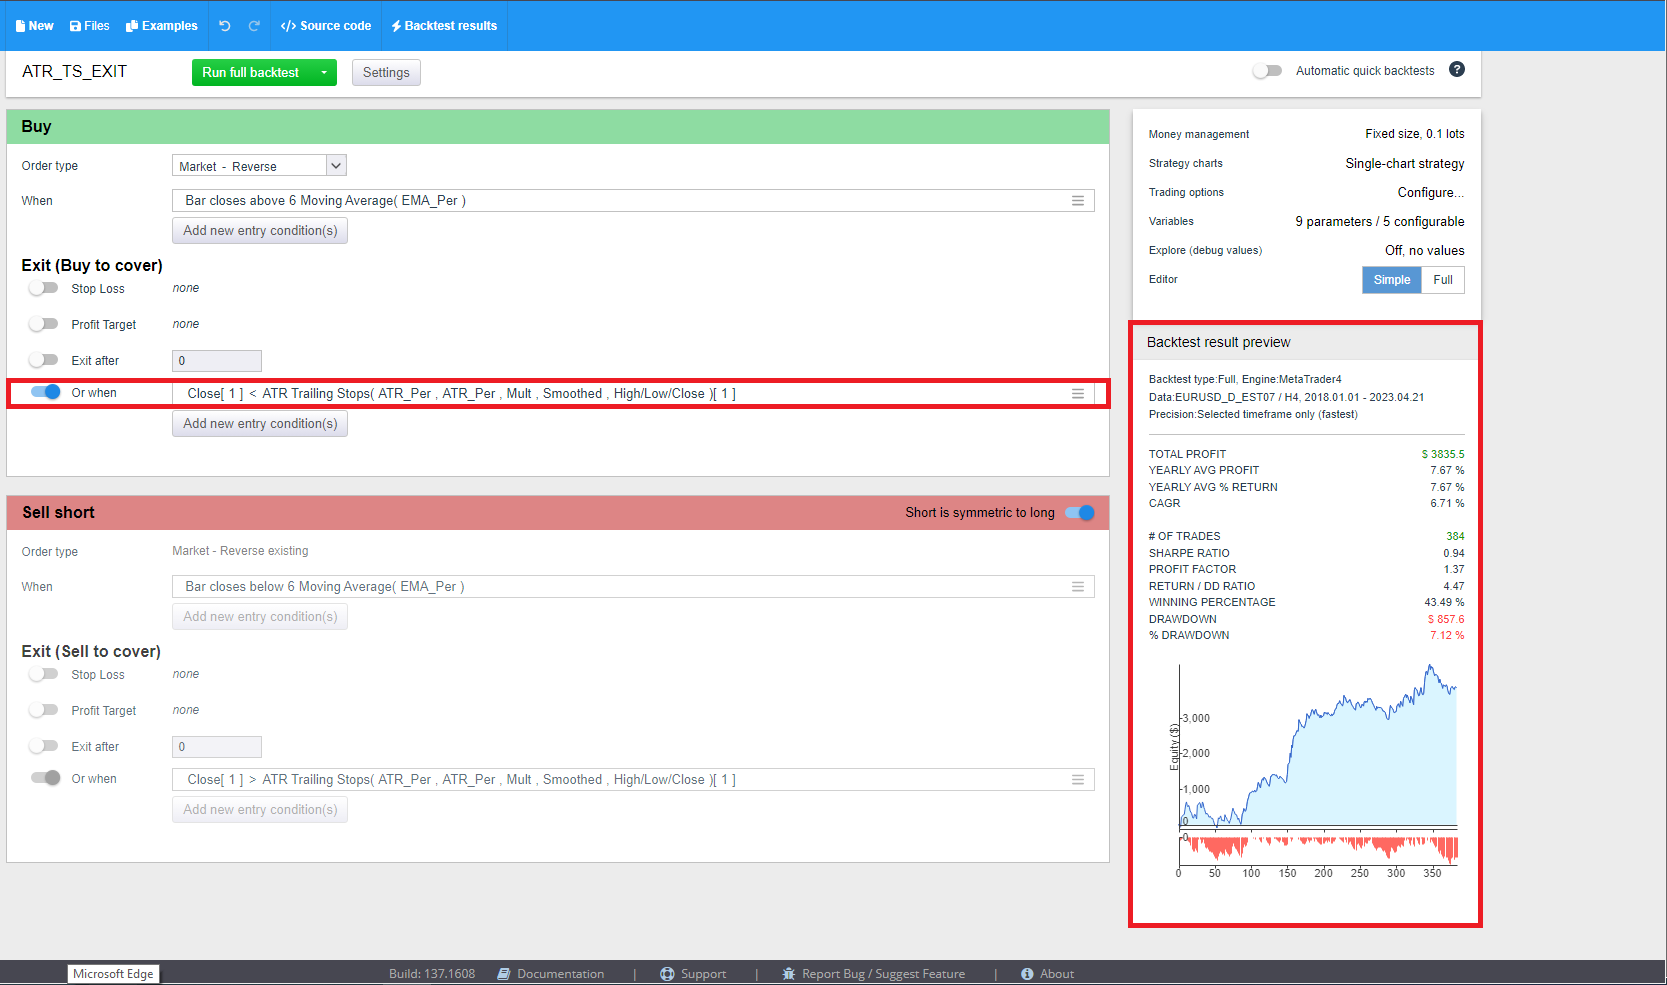
O indicador ATR Trailing Stops pode ser usado no Algowizard como StopLoss para sair da negociação, como podemos ver na figura abaixo.
Os ATR Trailing Stops também podem ser usados na parte de construção do programa StrategyQuantX, que usa técnicas de aprendizado de máquina e programação genética para gerar automaticamente novos sistemas automatizados.
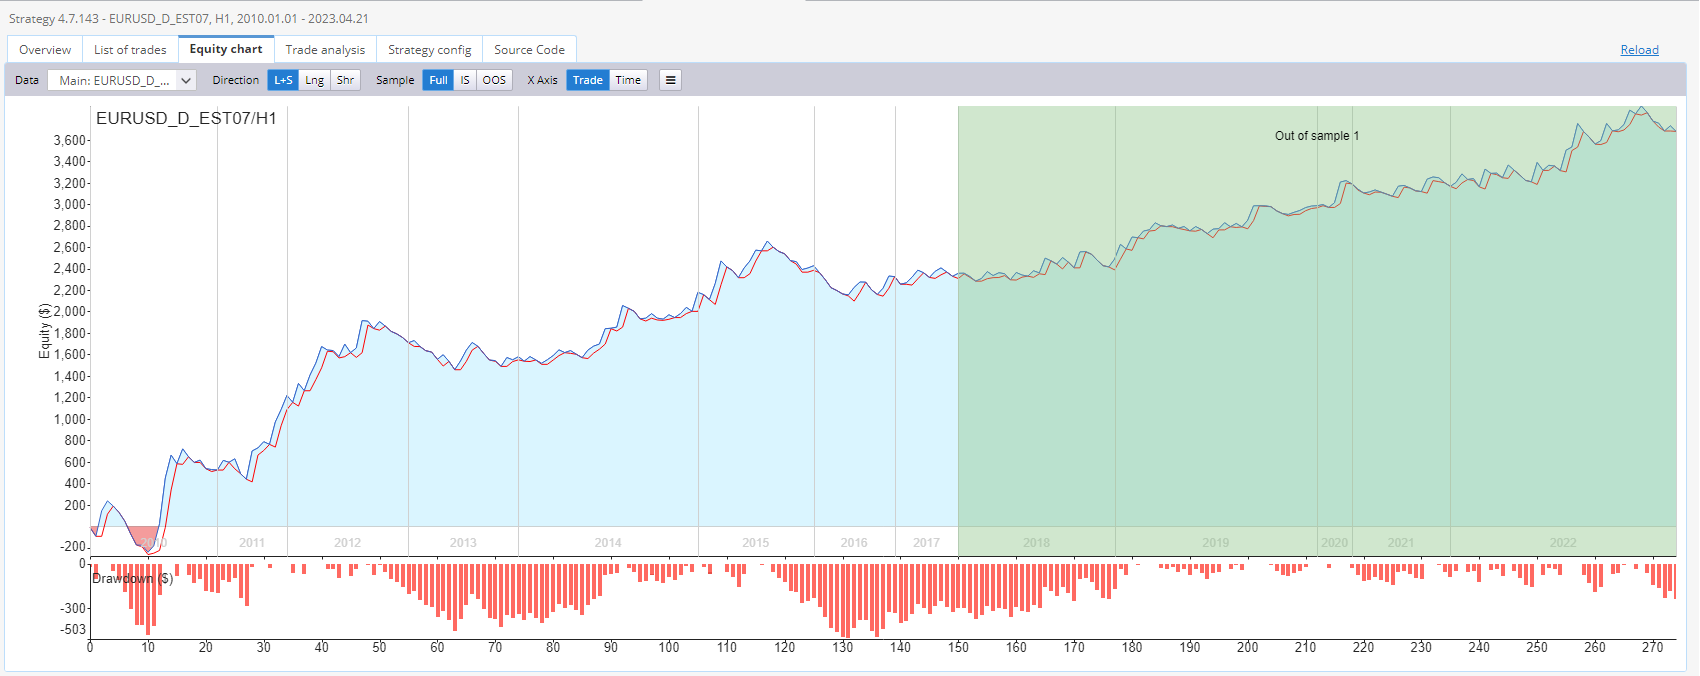
A imagem abaixo mostra a representação gráfica do desempenho de uma determinada estratégia de negociação usada no período de 1 hora do EURUSD. Essa estratégia foi projetada usando o indicador ATR Trailing Stop. A curva de patrimônio líquido, que é uma representação gráfica do lucro ou prejuízo gerado pela estratégia em um período de tempo específico, é usada para analisar o desempenho do sistema de negociação.
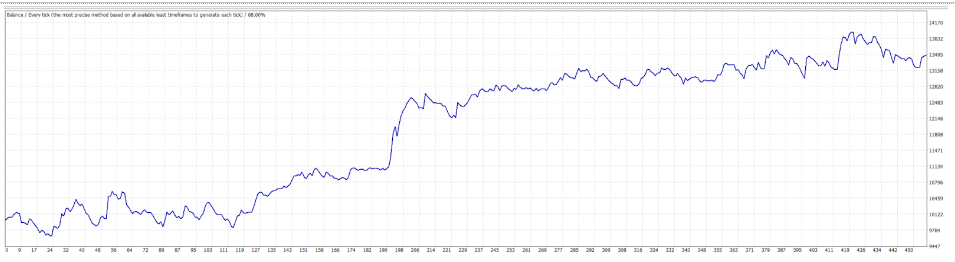
Na figura abaixo, há outro bom backtest do Metatrader 4 que descobri ao desenvolver uma estratégia para o par de moedas EURUSD no período de 4 horas usando dados da Darwinex.
Conclusão
O indicador de trailing stops ATR é uma ferramenta útil para os traders que desejam controlar seus riscos e melhorar suas estratégias de negociação. Ao aprender a usar essa ferramenta e reconhecer quando ela pode ser útil, os traders podem tomar decisões melhores e aumentar suas chances de fazer negociações lucrativas. Você pode experimentar diferentes períodos ATR, períodos ATR Avg, multiplicadores ou métodos de cálculo para encontrar a combinação mais adequada ao seu estilo de negociação e aos mercados em que atua.
Você pode baixar o indicador aqui.
O indicador é implementado para: MT4/MT5/Tradestation/ Multicharts
Você pode preparar facilmente suas condições como blocos personalizados no Algowizard. Mais informações podem ser encontradas aqui:
Neste módulo, você também pode modificar os blocos personalizados - alterar os períodos, alterar os passos, etc.
Como importar indicadores personalizados para SQX:


Esse indicador foi testado adequadamente no Tradestation? Acabei de tentar adicionar no TS uma estratégia gerada no sqx que o utiliza para entradas e negociações completamente incompatíveis entre o TS e o SQX - embora eu esteja usando os mesmos dados em ambos.
Você quer dizer que normalmente obtém uma correspondência entre os resultados, mas não com esse indicador?
Olá, sim, ele foi testado. Envie-me a estratégia que não está funcionando para o: hudec@Kevin.com
Qual é a diferença entre isso e o Trailing strop nos Tipos de Exity, além da suavização? Quando usar um em vez do outro?