In the last episode, we showed how your true-out-of-sample (WFOS ) can be affected by the complexity of the strategy combined with the number of trades. We found out that simpler strategies with a sufficient number of trades usually perform better in true-out-of-sample (WFOS )
In today’s episode, we look at whether using a spread ratio can lead to a better true-out-of-sample (WFOS ) result.
First, let’s repeat how we collected the data:
So we generated about 1.2 million strategies using only basic filters like a minimum number of trades and stability SQ3 > 0.6. We used the largest possible data sample for the period 1987-2017 IS + OS and for the period 2018-2020. ( WFOS )
We used the 2019-2020 period – two years – as the true-out-of-sample (WFOS ). During this period, we observed the effects of selection, robustness tests, and other analyses.
We developed strategies for a 1-hour time frame and a 4-hour time frame, we used the Darwinex fee structure, and we had 1 pip of slippage in each market.
Spread Sensitivity
For this experiment, we tested the entire data set with a spread that was 2 pips higher than the default spread at Darwinex.
For comparison purposes, we created a ratio of net profit higher spread / net profit standard spread. The objective was to find out whether the relationship between the performance of a strategy with a higher spread and its performance with a normal spread can have an impact on the future performance of the strategy.
Basic Spread Ratio analysis
Outliners with nonsensical ratios show up in the data set:
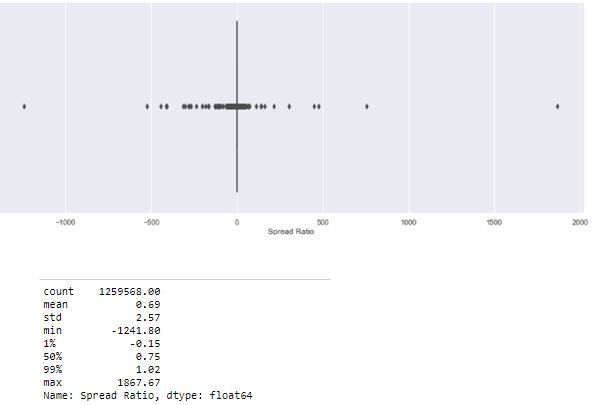
We, therefore, removed outliers from the dataset and selected strategists with a spread ratio of 0-1.
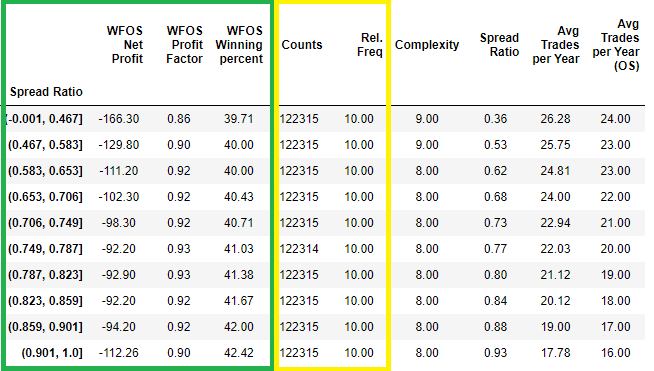
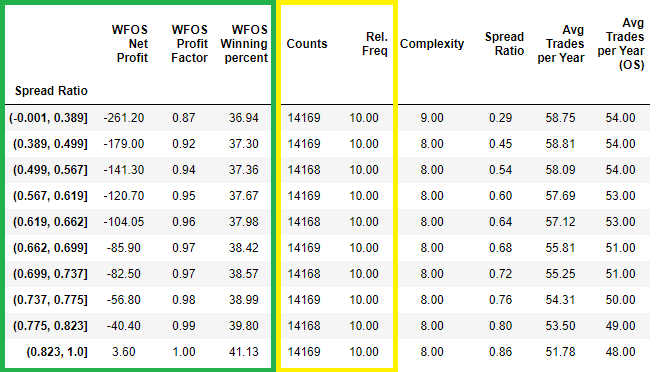
We binned the spread ratio into deciles and in each row, we see the median value of each statistic. That is, in the first row, all strategies with a spread ratio in the interval of -0.001 to 0.647 have a median net profit in the true-out sample of -$166.3 and so on.
Spread Ratio in equal-sized buckets based on deciles – table
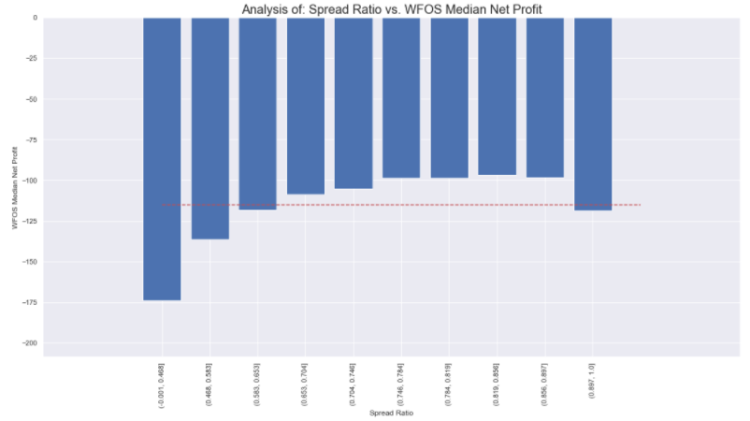
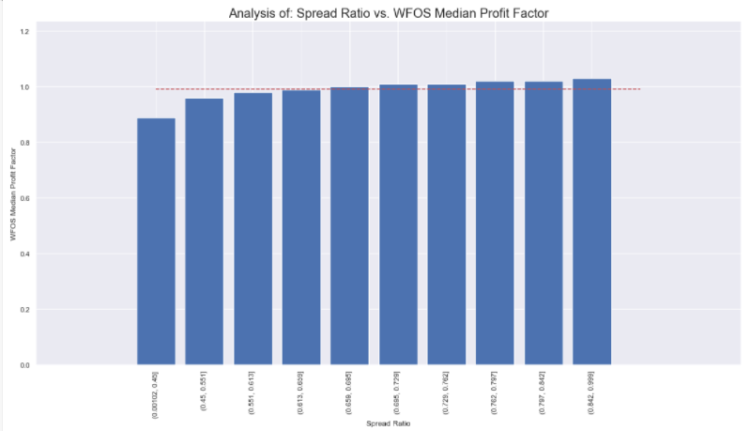
Spread Ratio vs. WFOS 2 Years Median Net Profit
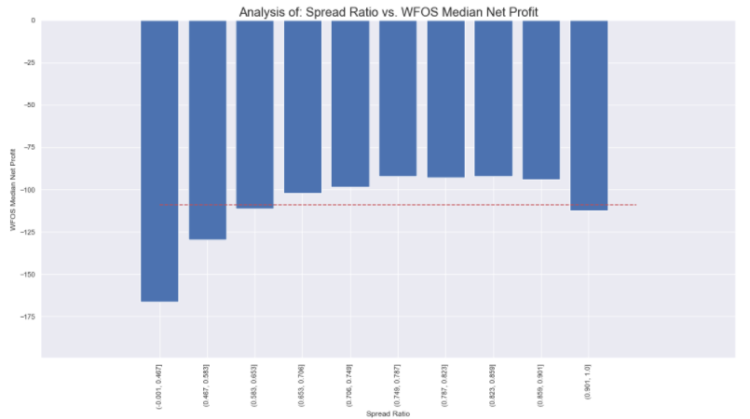
Note: The red line represents the average spread ratio value across the dataset
In the picture above we can see that strategies with a very low spread ratio have generally worse results than strategies with a higher spread ratio. I don’t want to say that this is not conclusive, because visually we can see a clear difference, but I thought further about what type of strategies spread sensitivity is important for. Strategies with a larger number of trades will understandably be more sensitive than strategies with a low number of trades.
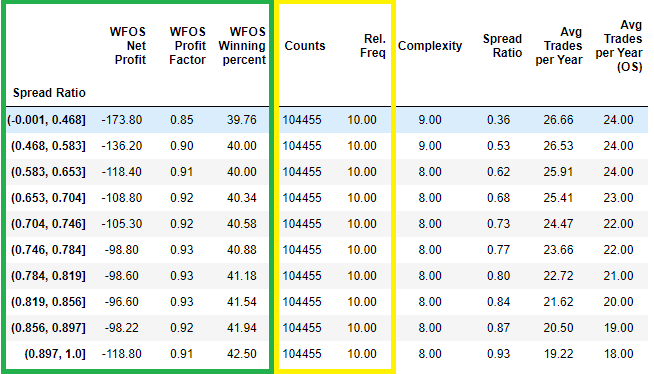
In the previous part, we adjusted the dataset to 480-2600 trades in the case of the number of trades. Let’s make it even better: we will work with the average number of trades per year.
I will choose strategies in the range Avg 15 Trades per Year to Avg. 80 Trades per Year.
Spread Ratio in equal-sized buckets based on deciles – table
Spread Ratio vs. WFOS 2 Years Median Net Profit
The results are comparable to the first selection. When I select strategies with 15 avg. trades per year to 18 avg. trades per year we see the difference between 1 and 2 deciles and then vs. other deciles. But again nothing special.
One fact to keep in mind. The more trades you have, the higher the statistical significance of the results.
Let’s look at it even better methodologically. Let’s take the Average Number of Traders per Year collected on Out-of-Sample Periods and choose a strategy with a 40 avg. trades per year to 80 avg. trades per year.
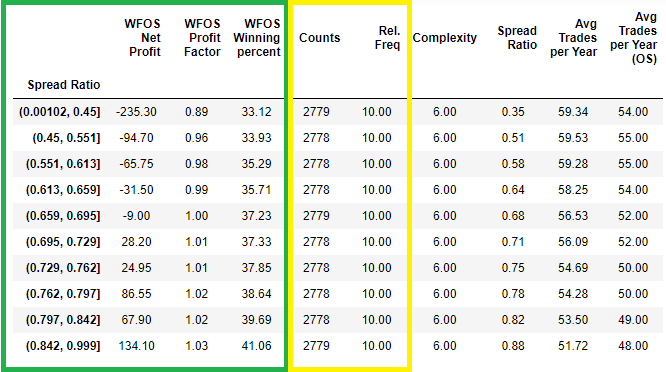
Spread Ratio in equal-sized buckets based on deciles – table
Spread Ratio vs. WFOS 2 Years Median Net Profit
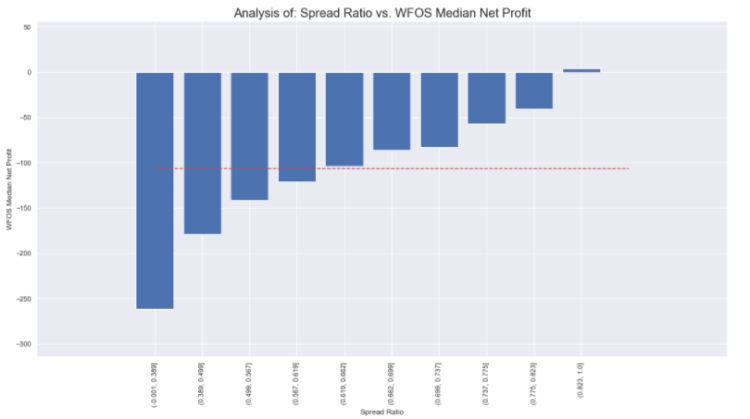
Wow. We can see a sharp difference. Logically, the higher the number of trades, the higher the sensitivity of the spread. You can see how effective this simple test can be.
We can clearly see that strategies with higher spread ratios in WFOS doing better than average.
Now let us combine the findings from last time. We choose strategies with a complexity of 4 to 6 and an avg. number of trades of 40 to 80 per year.
Spread Ratio in equal-sized buckets based on deciles – table
Spread Ratio vs. WFOS 2 Years Median Net Profit
The result is even better. We see that strategies with the complexity of 4-6, and 40-80 avg. number of traders per year in the out-of-the sample.
Conclusion
Our analysis suggests that the combination of the robustness of the spread resto can help the strategy in WFOS. However, it is important to keep in mind that this test only helps strategies with a higher number of trades.
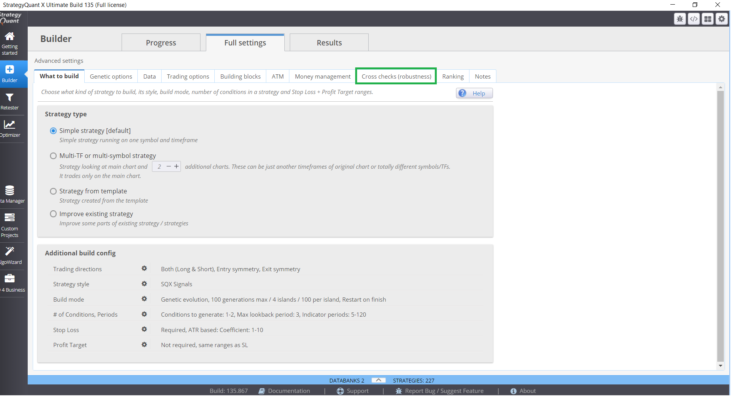
How we can set up this test in StrategyQuantX
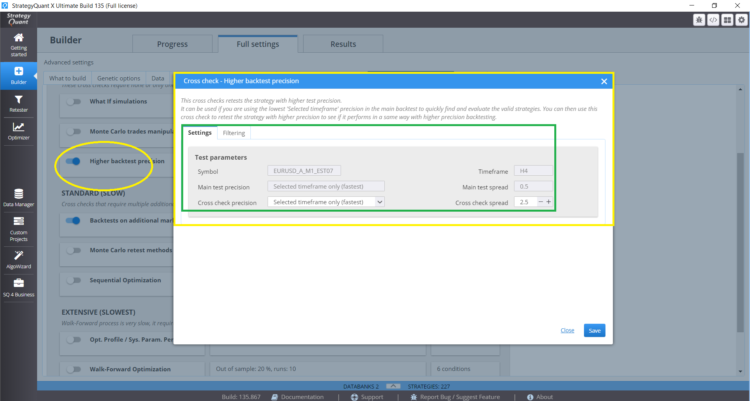
There are two ways to set up this test in Croschecks:
Select Higher Precision Test and set Crosscheck spread to 2.5 pip.
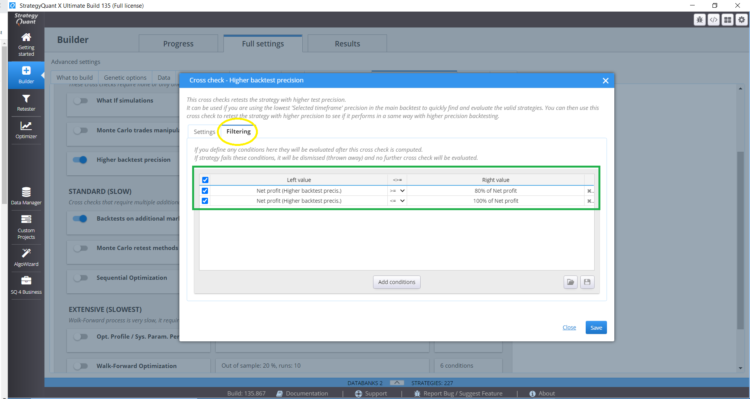
And set filtering tab properly:


 Tomas Vanek

“Our analysis suggests that the combination of the robustness of the spread resto can help the strategy in WFOS. However, it is important to keep in mind that this test only helps strategies with a higher number of trades.” As mentioned before in my part 1 comments, less complex strategies (such as intra day strategies) inherently has higher trade counts and likewise complex strategies (Breakouts/Swing strategies) with the aim to eliminate unwanted fail/unprofitable trades, has lesser trade counts. Hence, the use of spread ratio robustness testing works for less complex strategies with higher trade counts. My curosity is, whether the… Read more »
One way to test whether the use of spread ratio acts as an external filter to filter out mediocre and unsubstainable trades is to quantify or classify the types of strategies that pass every level of spread ratio. Assumptions: 1) Trade counts: Less complex (i.e simplier strategies) strategies tend to haven higher trade counts which may imply that it catches smaller trend cycle patterns which occurs more frequently. Complex strategy aim to catch larger trend cycle patterns and hence occur less frequently. 2) Win/loss and Risk Reward Ratio: Good/robust simplier strategies would have higher win/loss ratio but negative reward/risk ratio… Read more »
Hannahis could u clarify the operators used by clonex in the filter setting screenshot was unclear
Hi Stuart, I’m not the one conducting these test or write up the report, it’s Clonex/Ivan’s hard work. I’m just giving my 1 cent worth of thoughts and critique the results to highlight the possible use of result finding that may help users in their settings or understanding of the implications. I used to read up research papers and try to understand the underlying concepts etc, so I guess I’m just trying to apply it here and see what gems I can glean out of Ivan’s hard work. This research is bias, because it used Friday close so the set… Read more »
Is liken to choosing a job candidate. Do you look for how tall or short the candidate is (simple vs complex) or do you look for characteristics in the candidate for the specific training or skills sets needed for the job? So if we going to build robust strategies or target to build trending or ranging or mean reversal strategies, what are the characteristics or performance settings we need to look for that are suited for each of these strategy types? What really constitute robustness? It’s very vague, unless we look at the performance metric as a way to measure… Read more »
Could you clarify please, “ratio of net profit higher spread / net profit standard spread” – does this mean that for every strategy you’ve taken this value? Sorry, I think it was a little ambiguous
Ratio = NetProfit(spread_standard+2) / NetProfit(spread_standard)
Hi
it is : total net profit of the strategy ( IS + OS ) with higher spread ( 2 + pips compared to standard Darwinex spread ) / total net profit of the strategy ( IS + OS ) with standard Darwinex spread.
Excellent !!!!
I need to highlight the key assumptions I’ve made in this discussion. My key assumptions or hypothesis are 1) Less complex strategies = short trend strategies, such as intraday strategies = higher trade counts 2) Complex strategies = bigger/longer trend strategies such as Breakouts/Swing trades = lower trade counts Whether my assumption or hypothesis for the abovementioned is correct, we need looked that the straegies generated and examine the followings… 1) What kind of strategies have higher trade counts (by examine the characteristics of the performance metrics as I’ve mentioned before such as system metric, pf, win/loss ratio etc), 2)… Read more »
I want more blog posts like this, Much appreciated. Thank You
I hear you dont worry. They will be more and better 😉
Hi Clonex could you or someone clarify the operators that applied in the filtering is it >=80% and <=100% cannot clearly see the screen shot
Hi Stuart; Yes: 80-100
Excellent !!! Thank you !!!