LucidFlex Futures Evaluator
Page contents
The LucidFlex Prop Evaluator takes the trades from your StrategyQuant X backtest and replays them through the real LucidFlex rule set, in actual dollars, to tell you whether the strategy would have passed a LucidFlex evaluation or survived as a funded account.
Instead of guessing from generic stats, it simulates the account the way Lucid actually measures it: it groups your trades into trading days (US Eastern, daylight-saving aware), walks your balance day by day, applies the end-of-day trailing Max Loss Limit, checks the profit target and the 50% consistency rule, and estimates worst-case intraday equity from each trade’s MAE — so a day that closed green but dipped hard mid-session can still register as a breach, just like on a live account.
The result is a single clear verdict plus the numbers behind it, so you can see why it passed or failed and what to fix.
The controls (set these first)
- Account Type — Evaluation applies the profit target and the 50% consistency rule. Funded drops both (funded accounts have no target, no consistency, no daily loss limit) and instead asks one question: did the account survive the trailing drawdown? In funded mode you also get an estimated 90% payout figure.
- Account Size ($25K / $50K / $100K / $150K) — loads that tier’s real profit target, Max Loss Limit, trailing-lock point, and contract limits.
- Size Multiplier — scales every trade’s P&L and contract count. 1 = your backtest as-is, 2 = double the size, 0.5 = half. Because Lucid’s limits are fixed in dollars, sizing up grows profit and drawdown — use this to find the contract count that clears the target without breaching.
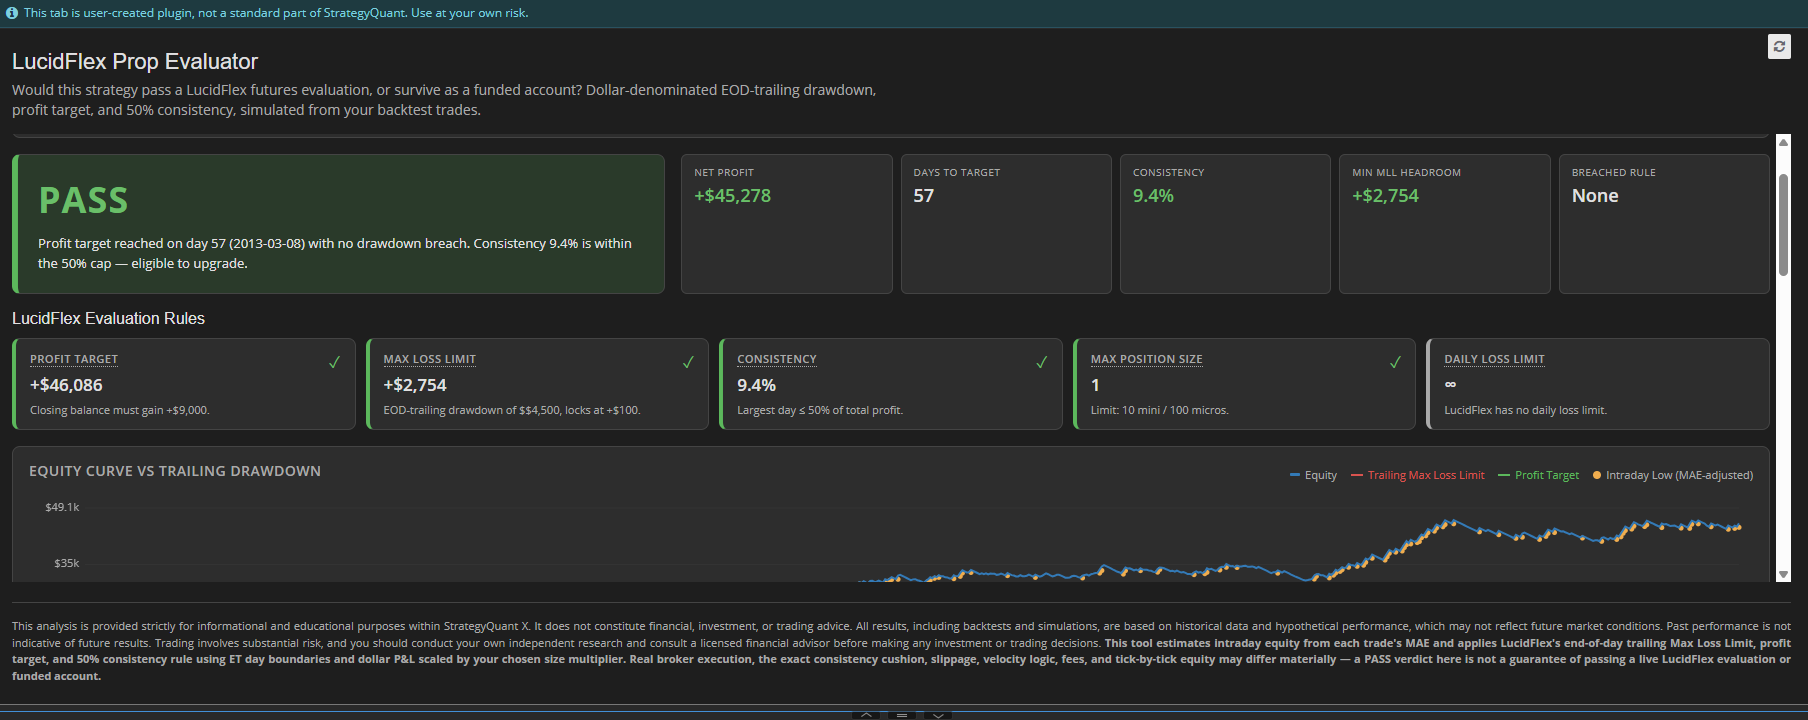
The verdict card
The big colored label is your bottom line:
- PASS (green) — all the account’s hard rules were satisfied. In Evaluation that means the target was reached, no drawdown breach, and consistency ≤ 50%. In Funded it means the account survived the whole backtest.
- ALMOST (amber) — Evaluation only. You hit the profit target without breaching, but your largest day is more than 50% of total profit, so you’re not yet eligible to upgrade. The fix is to keep trading and spread profit across more days.
- FAIL (red) — a drawdown breach occurred, or the profit target was never reached.
The line beneath names the exact reason and date, e.g. “Max Loss Limit breached on 2024-01-04 (day 3)” or “Target reached on day 2, but consistency is 94.1%.”
The KPI strip — how to read each value
| KPI | What it means | How to read it |
|---|---|---|
| Net Profit | Total closed P&L over the backtest, in dollars, after the size multiplier. | Green = profitable. For Evaluation it should comfortably exceed the tier’s target. |
| Days to Target | How many trading days it took to first reach the profit target. | Fewer days = faster pass, but watch consistency — a fast pass often leans on one big day. —
|
| Consistency | Largest single-day profit ÷ total profit, measured up to the target day. | ≤ 50% = good (eligible). Above 50% = one day carries too much of the profit; not eligible yet. Lower is better. |
| Min MLL Headroom | The smallest gap between your worst intraday equity and the trailing Max Loss Limit at that moment, in dollars. | This is your closest brush with blowing the account. Positive = survived; the bigger the cushion, the safer. A small positive number means a near-miss. Negative means a breach. |
| Est. Payout (90%) | Funded only. Your 90% share of net profit. | Your take-home if this run were a funded account. |
| Breached Rule | Which rule failed, or None. | Tells you at a glance what to fix. |
The rule cards
Each card shows the rule, its current value, the limit, and a colored status (✓ pass, ! warning, ✗ fail). Hover any label for a plain-language explanation.
- Profit Target (Evaluation) — your best closed profit vs. the tier's required gain. ✓ once you reach it.
- Max Loss Limit — shows your minimum headroom above the trailing drawdown line. The line starts one MLL below your balance, trails your highest end-of-day close, and locks permanently once it reaches your starting balance + $100. After that lock, your account can never drop below break-even +$100. ✓ if you never touched it, ✗ if you did.
- Consistency (Evaluation) — largest day as a % of total profit. ✓ ≤ 50%, ! above.
- Max Position Size — the largest position used (after the multiplier) vs. the tier's mini/micro limit. This is informational: the tool can't tell mini contracts from micros, so verify against your actual instrument.
- Daily Loss Limit — shown as ∞ because LucidFlex has no daily loss limit. The trailing MLL is the only loss rule.
The charts — how to read them
- Equity Curve vs Trailing Drawdown — your balance (blue) against the rising red Max Loss Limit line and, in Evaluation, the green profit target line. The closer the blue line gets to the red line, the closer you came to a breach. Amber dots mark days where intraday equity dipped well below the close (MAE-estimated lows). A clean pass keeps blue comfortably above red and crosses green.
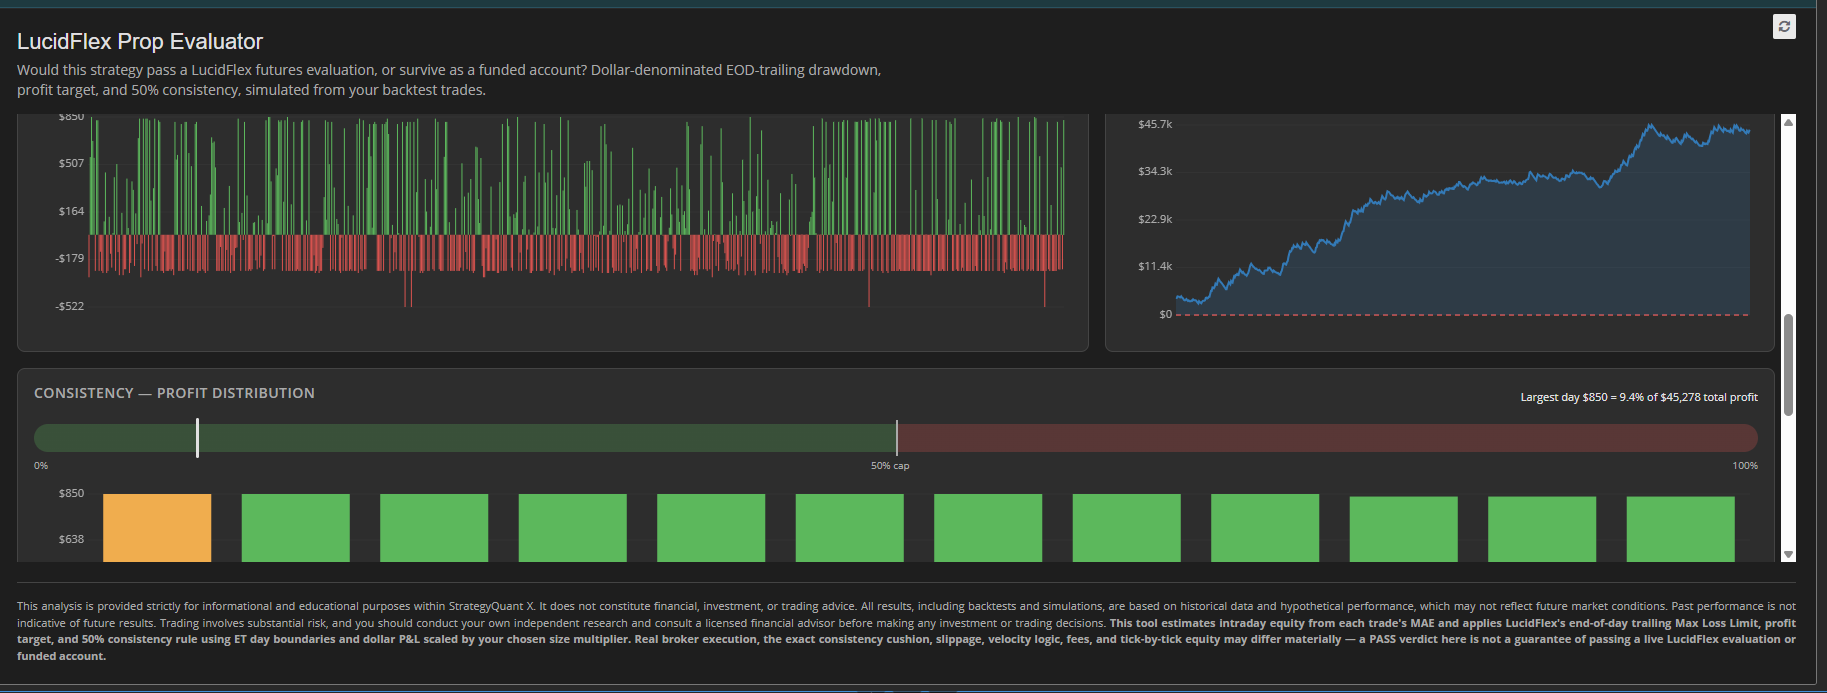
- Daily P&L — each day's net result. Green bars up, red bars down. Look for whether profit is spread across many days (healthy) or driven by a few spikes (consistency risk).
- Headroom Above Trailing MLL — distance, in dollars, between your worst intraday equity each day and the drawdown line. The closer this line gets to the $0 breach line, the more dangerous the account. Touching $0 = breach.
- Consistency — Profit Distribution — a gauge showing where your largest day sits relative to the 50% cap, plus your biggest profit days. If the first bar dominates, you're leaning on one lucky day.
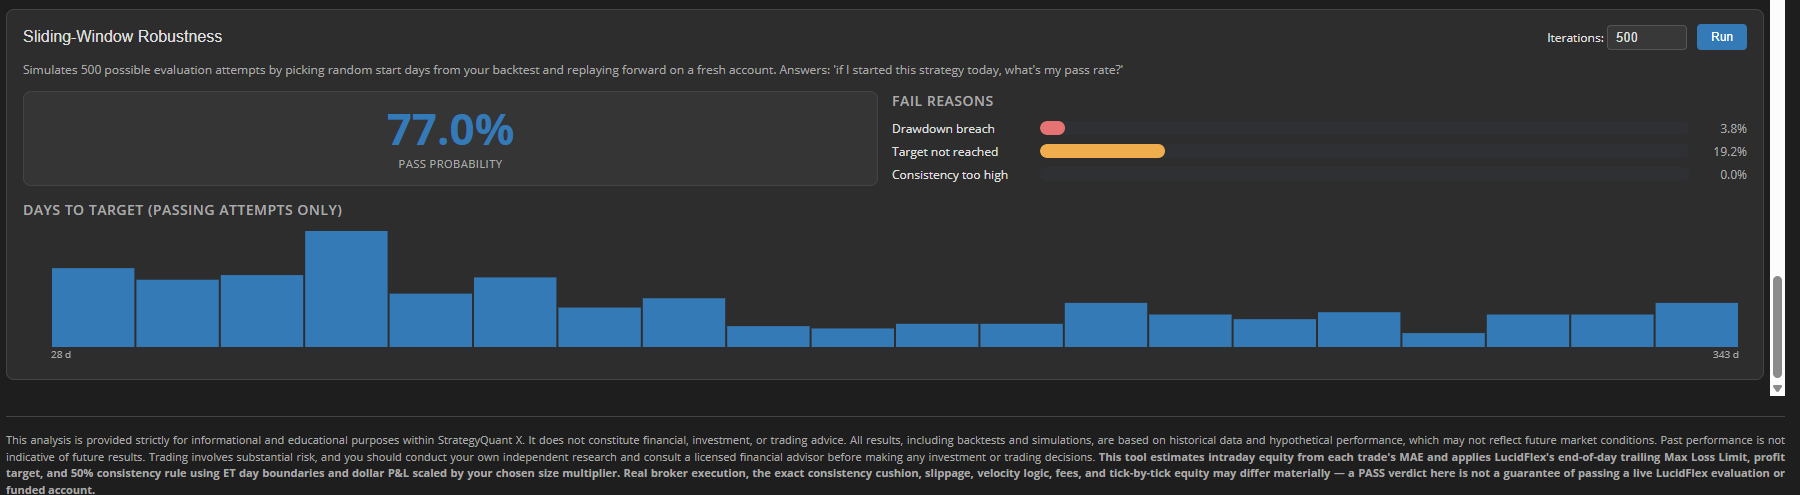
Sliding-Window Monte Carlo (Evaluation)
Because your backtest is just one possible run, this simulation re-tests the strategy by starting it on many different days in your history and replaying forward on a fresh account. It answers: "If I began this strategy today, how often would I pass?"
- Pass Probability — share of simulated attempts that passed. Treat > ~60% as a strong candidate, 40–60% as borderline, < ~40% as a sign your single backtest PASS was mostly timing/luck.
- Fail Reasons — how the failing attempts failed: drawdown breach (cut risk or size), target not reached (not profitable enough), or consistency too high (profits too concentrated).
- Days to Target histogram — the spread of how long passing attempts took, so you know whether a quick pass is typical or exceptional.
Needs at least ~40 trading days of history to run, and the more days you have, the more trustworthy the probability.
How to use it in practice
- Pick your account type and size, and set the size multiplier to match how many contracts you'd actually trade.
- Read the verdict — but don't stop there.
- Check Min MLL Headroom: a thin cushion means you'd be one bad session from a breach even if it technically passed.
- Check Consistency: a fast pass with consistency near or above 50% isn't really a pass yet.
- Run the Monte Carlo and look at the pass probability and how it tends to fail — that tells you what to improve.
How to install
- Download / copy the LucidFlex Prop Evaluator folder into your SQX plugins directory:<SQX-install>/user/extend/ResultsPlugins/LucidFlex Prop Evaluator/Keep the folder intact — it must include index.html vue.global.prod.js, and the locales/ folder.
- Restart StrategyQuant X (or click the reload icon in the Results tab) so SQX registers the plugin.
- Open any backtest → Results tab → select LucidFlex Prop Evaluator from the tab strip.
- Pick your account type and size, and read the verdict.
Requirements: SQX Pro (up to 3 custom plugins) or Ultimate (unlimited). The Starter tier does not support custom plugins.
For informational and educational use only — not financial advice. A backtest PASS is not a guarantee of passing a live LucidFlex account.
