Strategy VS Random Edge Testing: WinRateEdge Results Panel
WinRateEdge — System Overview
WinRateEdge is a statistical edge-testing framework for StrategyQuant X that answers one precise question: does your entry signal find genuinely better moments to enter the market than random timing would? Rather than judging a strategy by its equity curve alone — which can look good due to market drift, favourable exits, or a lucky test window — WinRateEdge isolates the entry signal and tests it directly against a large pool of randomly timed trades.
How it works
The system connects three tools inside SQX. First, you build your theory test in Algo Wizard using your chosen entry signal with a fixed stop loss and take profit. Next, you use the included RAND building block in the Builder to generate random-entry strategies on the 1-minute timeframe, matched to the same symbol, date range, and exit rules as your theory test. Running 5–20 of these builds accumulates a large pool of random trades that forms your baseline. Finally, you load everything into Retester as a combined portfolio, where the WinRateEdge Result Panel takes over.
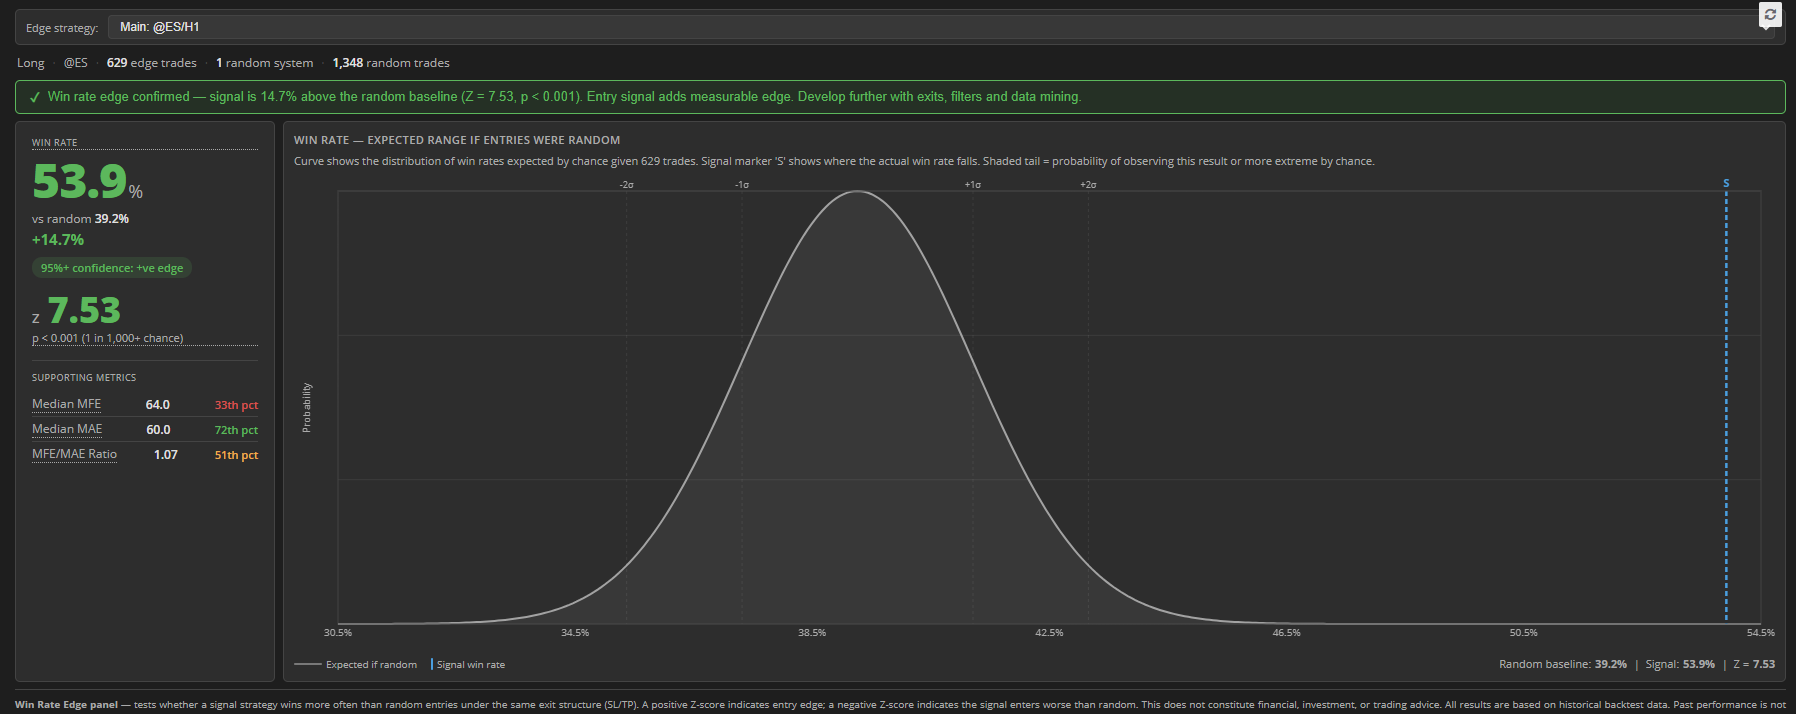
The panel computes the win rate of your signal trades versus the pooled random baseline and displays the result as a bell-curve chart, showing exactly where your strategy sits relative to the distribution of random outcomes. The key output is a Z-score — a confidence rating that tells you how likely the result is to be real rather than chance. A Z-score of 1.645 means 95% confidence. A score of 3.09 means 99.9%. The panel selects your theory backtest from a dropdown, so you can compare multiple entries against the same random pool.
Why the random baseline matters
Random entries almost never win 50% of the time. The true baseline depends on market drift, your exit rules, and spread — which is why WinRateEdge measures it directly from your own data rather than assuming it. A market like US100 has drifted strongly upward for years, meaning random long entries already win well above 50% on that instrument. Your signal needs to beat that measured baseline to demonstrate genuine edge.
Parameter sweeps and cross-market validation
The system includes a companion guide on testing across multiple parameter settings — for example, sweeping a Donchian channel from period 5 through 30 to understand where the edge lives. It explains how to read the shape of results across a sweep (a broad plateau of consistent results is far more meaningful than a single isolated spike), how multiple testing affects your confidence figures, and how cross-market validation — running the same parameter on an independent instrument — is the cleanest way to confirm that a detected edge is structural rather than specific to one market’s history.
What it tells you — and what it doesn’t
A confirmed edge over random means your entry signal is finding statistically better moments to get into the market. It is a necessary foundation for a robust strategy, but not a guarantee of live profitability after costs and execution. Think of it as the first filter in a serious research process: if the entry can’t beat random timing, nothing else about the strategy matters much. If it can, you have something genuinely worth building on.
