Documentation
Applications
Last updated on 18. 5. 2020 by Mark Fric
Chart – Accepted strategies per hour
Page contents
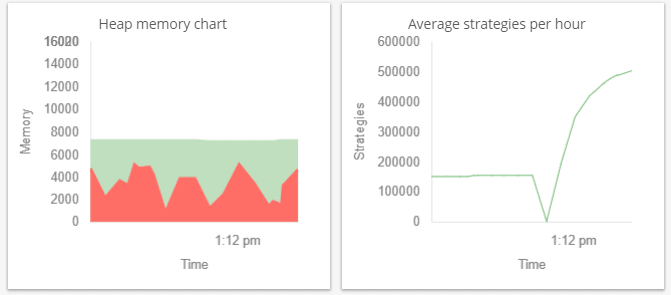
Engine charts are small charts that are visible in the Engine – for example Heap memory chart or Average strategies per hour chart.
As same as most of the things in SQ X, these charts are implemented using Snippets, which means they are extendable – you can add your own chart there.
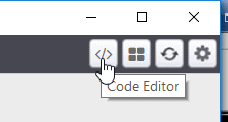
Step 1 – Open Code Editor
Click on the Code editor icon to switch to Editor.
Step 2 – Create new Engine chart snippet
There is no wizard ofr engine charts yet, but you can easily clone an existing snippet and modify it to display accepted strategies per hour.
In the Navigator tree on the right go to Snippets -> SQ -> Engine charts, then click on the AverageStrategiesPerHour.java with right mouse button, and choose Clone.
Name the new file AcceptedStrategiesPerHour.
This will create a cop of the existing snippet that displays average strategies per hour. Now we only have to modify it to display accepted strategies per hour instead or average.
Step 3 – modify the snippet
There isn’t actually much to modify – we’ll modify the obvious, like snippet and chart name, and the only method that needs to be modified is method addNextValue() where the next value for the chart is set.
We’ll modify it from
series.addValue(System.currentTimeMillis(), projectRunInfo.strategiesPerHour);
to
series.addValue(System.currentTimeMillis(), projectRunInfo.acceptedStrategiesPerHour);
We were lucky with this snippet, because SQ already computes this statistics, so we only have to create a new chart that uses it.
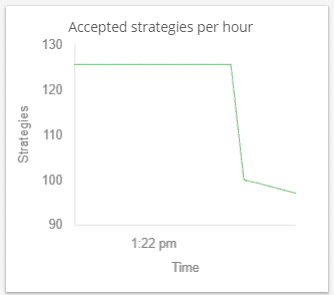
Step 4 – Recompile and restart SQ
and you’ll see new chart available in all engine panels:
Here is full code of the snippet:
package SQ.EngineCharts;

import org.json.JSONObject;

import com.strategyquant.lib.*;
import com.strategyquant.datalib.*;
import com.strategyquant.tradinglib.*;

public class AcceptedStrategiesPerHour extends EngineChart {
  private TimeSeriesLineChart chart = null;
  private TimeSeries series = null;

  private ProjectRunInfo projectRunInfo = new ProjectRunInfo();
  private ProjectRunInfo oldProjectRunInfo = new ProjectRunInfo();

  private int checksSinceLastChange = 0;

  public AcceptedStrategiesPerHour() {
    super(L.t("Accepted strategies per hour"), TYPE_PROJECT_BASED);

    this.chart = new TimeSeriesLineChart();
    this.chart.yAxisTitle = L.t("Strategies");
    this.chart.xAxisTitle = L.t("Time");
    this.chart.maxTicksLimit = 4;
    this.chart.yAxisRangeMin = 0;

    this.series = new TimeSeries(L.t("Accepted str. per hour"), 20);
    this.series.color = ChartsConst.COLOR_GREEN;
    ((TimeSeriesLineChart)this.chart).addSeries(series);

    	oldProjectRunInfo.totalJobsDone = -1;
    	checksSinceLastChange  = 0;
  }

  @Override
  public JSONObject print() {
    JSONObject data = new JSONObject();

    project.loadTrackingInfo(projectRunInfo, false);

    checksSinceLastChange++;

    if((oldProjectRunInfo.totalJobsDone == -1 || projectRunInfo.totalJobsDone != oldProjectRunInfo.totalJobsDone) || checksSinceLastChange > 10) {

      // refresh only if something changed
      oldProjectRunInfo.totalJobsDone = projectRunInfo.totalJobsDone;
      checksSinceLastChange = 0;

      data.put("type", DATA_TYPE_CHART);
      data.put("chart", this.chart.toJSON());

      return data;
    } else {
      return null;
    }
  }

  @Override
  public void addNextValue() {
        try {
        	series.addValue(System.currentTimeMillis(), projectRunInfo.acceptedStrategiesPerHour);
        } catch(Exception e) {
        	Log.error("Exc.", e);
        }
    }
}
Was this article helpful? The article was useful The article was not useful