¿Puede una plataforma comercial como StrategyQuant resistir un riguroso escrutinio académico? ¿Es capaz de replicar complejos artículos de investigación con precisión cuantitativa? Y lo que es más importante, ¿puede servir como plataforma fiable para identificar conocimientos estructurales dentro de nuestra investigación sistemática? Estas son las preguntas fundamentales que me propongo responder. En este estudio de caso, analizo cómo se pueden abordar estas cuestiones mediante la creación de un riguroso marco SQX para evaluar una destacada estrategia académica de «Opening Range Breakout» (ORB), un modelo que, en un principio, arrojó una rentabilidad anual del 9,3% y un ratio de Sharpe de 2,5 en los mercados de futuros asiáticos.
¡Hola a todos! Me llamo Jorge Moncada y hace poco me he licenciado en Economía y Finanzas por la Universidad Autónoma de Madrid (UAM). Gracias al apoyo del equipo de StrategyQuant, que me brindó la oportunidad de desarrollar mi trabajo de fin de grado utilizando su plataforma, me complace compartir cómo puse a prueba SQX para abordar el tema central de mi investigación: “Optimización evolutiva de una estrategia intradía: un enfoque basado en algoritmos genéticos para la ruptura del rango de apertura en los mercados de mediana capitalización de EE. UU.”. Aunque el proceso de ingeniería completo, paso a paso, se detalla en el artículo completo, este artículo se centra directamente en poner a prueba nuestras hipótesis de partida y en demostrar cómo funciona SQX como entorno cuantitativo de nivel institucional.
(Aviso legal sobre la investigación: Este artículo tiene fines exclusivamente educativos y de investigación. Presenta un estudio de caso teórico y no constituye un consejo de inversión ni una recomendación financiera. Todos los resultados de las pruebas retrospectivas son hipotéticos y no garantizan el rendimiento futuro.)
El objetivo principal de mi tesis era evaluar la portabilidad de una variante evolutiva y muy sofisticada de la estrategia ORB clásica en una microestructura de mercado diferente. En concreto, seleccioné un modelo ORB complejo diseñado por un equipo de matemáticos e ingenieros de Taiwán (Wu et al., 2021). Aunque su artículo original presentaba resultados sólidos en la negociación de futuros sobre índices taiwaneses (TXF), yo quería poner a prueba su resistencia estructural en un entorno completamente diferente e hipercompetitivo: el contrato de futuros E-mini S&P MidCap 400 de la CME (EMD), que sirve como un indicador realista y de mayor beta del mercado de índices estándar de EE. UU. En esta entrada, veremos cómo se recreó por completo esa intrincada lógica académica dentro de SQX, desde la configuración inicial de la lógica interna de ORB (que comparto como descarga gratuita para la comunidad) hasta la optimización de parámetros mediante algoritmos genéticos y análisis WalkForward continuo.
El reto AlgoWizard: Creación de una máquina de estados matemática
Reproducir la lógica fundamental del artículo original no fue una simple cuestión de copiar y pegar; todos sabemos lo fácil que es seguir una idea vaga como “compramos tras las rupturas al inicio de la sesión”, pero convertir un artículo matemático en un script ejecutable, absoluto e infalible es otra historia completamente diferente. Para lograrlo, me sumergí en el AlgoWizard Módulo para crear una máquina de estados intradía totalmente automatizada que funcione estrictamente al inicio de la sesión, utilizando datos de 1 minuto.
En lugar de basarnos en simples líneas de máximo o mínimo, nuestra estrategia ORB modelizada crea un marco intradía dinámico basado en una estructura secuencial: en primer lugar, al inicio de cada sesión se activa una fase de reinicio diario que borra los parámetros del día anterior y establece las líneas iniciales a partir de la primera barra de 1 minuto completada, con el fin de evitar la contaminación de los datos entre sesiones. A continuación, una fase de acumulación de 30 minutos realiza un seguimiento dinámico de los límites máximos y mínimos móviles del activo (h y l). Exactamente en el compás número 30 (8:30 de la mañana), la ventana de inicialización se bloquea y ejecuta la fase de decodificación de parámetros, congelando el rango y calculando la desviación estándar histórica de 30 minutos (σ) para generar nuestros límites ajustados a la volatilidad:
Pero = h + ε₁ × σ y Bl = l - ε₂ × σ
Una vez que la regla “Rangeready” se codifica como verdadera, la estrategia supervisa los desencadenantes de ejecución y lleva a cabo una entrada en el mercado en el momento exacto en que una barra rompe estos límites dinámicos. Al mismo tiempo, se establece la distancia inicial del stop-loss de protección (SL) basándose en una fracción (TSL) de la anchura total del rango ajustado:
SL = TSL × (Pero - Bl)
Por último, para gestionar el ciclo de vida de la operación activa, la máquina de estados utiliza un motor de salida dinámico que realiza un seguimiento del máximo absoluto del precio favorable alcanzado desde la entrada (precio_máximo para posiciones largas o precio_mínimo (para posiciones cortas). Si las ganancias no realizadas alcanzan un umbral mínimo exigido, la posición se liquida de forma proactiva si el activo retrocede desde su máximo en una proporción genética específica (RDD), lo que permite asegurar la alfa antes de que se produzca un cambio brusco de tendencia:
Condición de salida larga: Cerrar ≤ precio_máximo - RDD × (precio_máximo - Precio de apertura de la orden)
Condición de salida corta: Cerrar ≥ precio_mínimo + RDD × (Precio de apertura de la orden - precio_mínimo)
Evolución del espacio de parámetros mediante algoritmos genéticos (GA) y el método WFA
Para explorar este panorama de forma sistemática, el motor evolutivo se centra en optimizar simultáneamente cuatro parámetros fundamentales: las sensibilidades de entrada (ε₁ y ε₂) y los multiplicadores de salida de protección (TSL y RDD).
En lugar de dejar que el algoritmo busque entre un número infinito de valores, establecemos un espacio de búsqueda discreto y estricto que se ajusta a los límites del artículo original, donde los coeficientes de umbral (ε₁, ε₂) varían entre -1 y 1 en incrementos de 0,03125 (o 1/32), y los parámetros de salida (TSL, RDD) se seleccionan de un conjunto reducido y discreto de multiplicadores: {0,33; 0,66; 1,0; ∞}. Con una configuración tan compleja, que incluye umbrales adaptativos y múltiples capas de cierre de protección, nuestro espacio de parámetros alcanza rápidamente más de 65 000 combinaciones posibles.
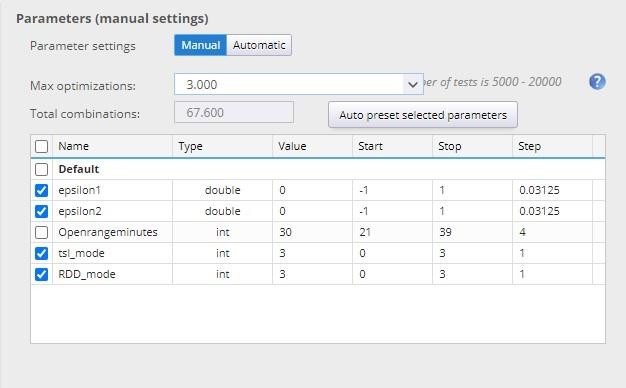
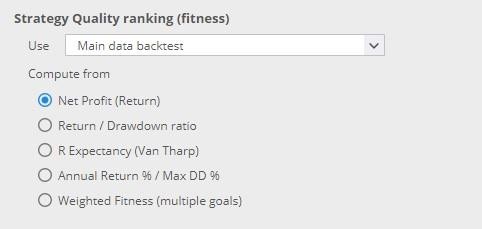
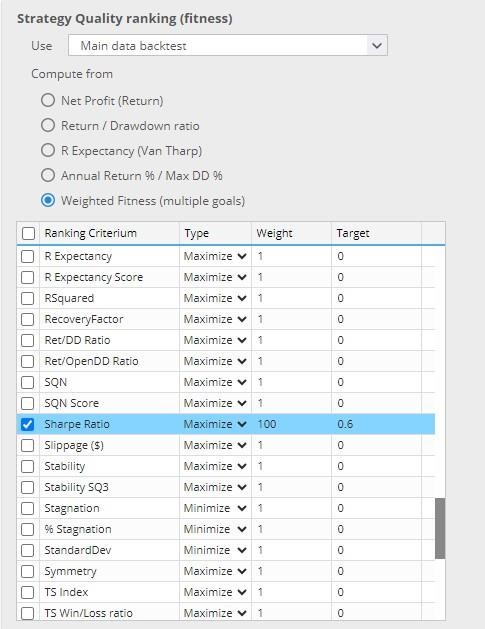
Dado que realizar una búsqueda exhaustiva por cuadrícula en este espacio supone una carga computacional significativa y aumenta el riesgo de sobreajuste estadístico, utilicé en su lugar un algoritmo genético (AG). Un AG es un motor de optimización basado en los principios de la selección natural. En lugar de comprobar cada combinación una por una, parte de una población aleatoria de conjuntos de parámetros, evalúa su aptitud con los datos de entrenamiento y los hace evolucionar a lo largo de sucesivas generaciones mediante operadores de cruce y mutación. Dentro del optimizador SQX, diseñé tablas de búsqueda discretas que se ajustaran perfectamente a los límites del artículo, utilizando la clasificación de aptitud ponderada nativa para optimizar bien la rentabilidad bruta, bien la estabilidad de Sharpe ajustada al riesgo.
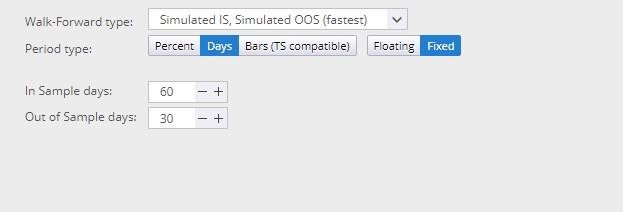
Para asegurarnos de que no nos limitábamos a ajustar la curva a los datos históricos, el algoritmo genético (GA) se combinó con un análisis «Walk-Forward» continuo. Implementé una estructura de renovación fija con una ventana de entrenamiento «In-Sample» de 60 días y una ventana de prueba «Out-of-Sample» de 30 días. El motor genético identifica los ajustes óptimos de los parámetros en los últimos 60 días de datos de entrenamiento, fija la configuración ganadora y la somete al instante a pruebas de estrés con los siguientes 30 días de datos de mercado no vistos. Este proceso avanza continuamente a lo largo de toda la muestra histórica de 2009 a 2018.
Resultados empíricos de rendimiento
Los seis modelos optimizados distintos, derivados de nuestros dos objetivos de rendimiento (maximizar la rentabilidad bruta frente a dar prioridad a la estabilidad del índice de Sharpe ajustado al riesgo), se sometieron a un exhaustivo backtest con los datos históricos del contrato EMD. A continuación se muestra la tabla resumen del rendimiento verificado, extraída de la documentación principal de la investigación:
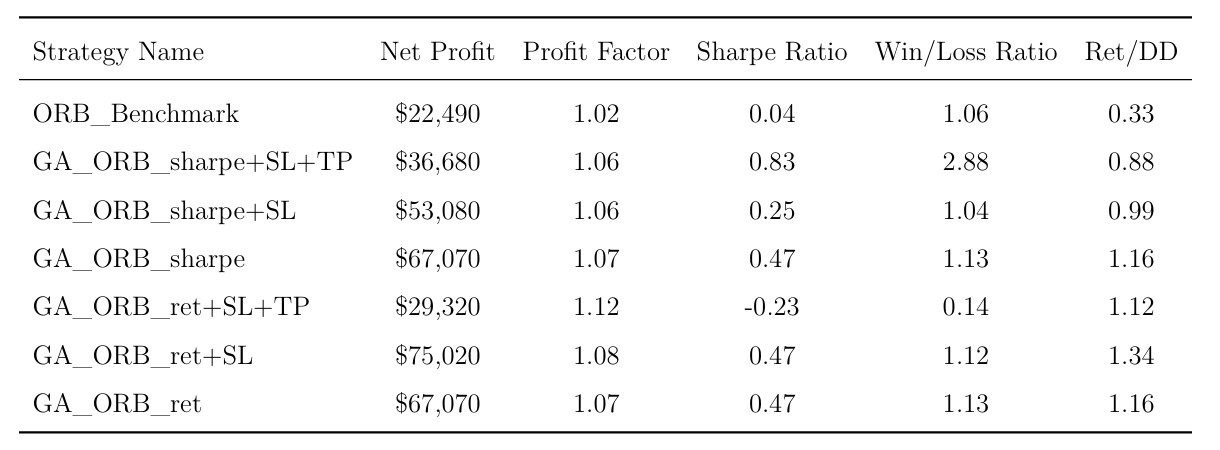
Tabla 6.2: Indicadores de rendimiento de las estrategias evolutivas basadas en ORB en el EMD.
Estas métricas ponen de manifiesto una divergencia significativa en el rendimiento en comparación con los resultados originales de Wu et al. (2021) en el mercado taiwanés (TXF). En su muestra original, los modelos que incorporaban un mecanismo de stop-loss lograron un aumento de la rentabilidad media anual de 2,667% (con un máximo de 9,303%) y una mejora del ratio de Sharpe de aproximadamente 1,0 unidad (con un máximo de 2,495), al tiempo que redujeron a la mitad la caída máxima (MDD). En nuestro entorno de empresas de mediana capitalización de EE. UU., aunque el enfoque evolutivo siguió generando beneficios constantes, las cifras absolutas de estabilidad ajustadas al riesgo variaron, lo que sugiere que la mayor liquidez y el ruido estructural de la bolsa CME imponen restricciones específicas a los parámetros fijos de stop-loss.
Al analizar las capas evolutivas básicas (los modelos simplificados), se observó un consenso sorprendente entre los planteamientos orientados al rendimiento y los ajustados al riesgo, ya que ambos convergían en exactamente los mismos parámetros internos (ε₁ = -1, ε₂ = -1). Aunque ambas estrategias superaron de forma significativa al índice de referencia ORB en cuanto a rentabilidad total de la renta variable, mostraron una mayor volatilidad por sí mismas y no reflejaron plenamente la tendencia alcista estructural del índice durante el periodo 2012-2016, manteniéndose prácticamente estables durante los periodos de baja volatilidad.
La introducción de la lógica de stop-loss arrojó resultados muy dispares. Si bien el modelo GA_ORB_ret + SL alcanzó la rentabilidad bruta más alta de todo el estudio ($75 020), esta cifra abarca una muestra histórica de diez años (2009-2018), lo que implica una rentabilidad absoluta anualizada modesta que sería muy sensible a las fricciones de ejecución. Además, su curva de capital se mantuvo estrechamente vinculada a la volatilidad subyacente del mercado. Por el contrario, el modelo GA_ORB_sharpe + SL obtuvo un rendimiento inferior al de su homólogo «naïve», lo que redujo su ratio de Sharpe de 0,47 a 0,25. Este comportamiento empírico sugiere que, en entornos ruidosos y altamente competitivos, un stop-loss fijo y estricto puede penalizar con frecuencia a un sistema al liquidar prematuramente las operaciones justo antes de que empiecen a ser rentables.
Los modelos que incorporan la salida basada en el retroceso (RDD) introdujeron un cambio de comportamiento matizado en comparación con la bibliografía de referencia. La configuración GA_ORB_sharpe+SL+TP alcanzó la mayor estabilidad ajustada al riesgo, con un ratio de Sharpe de 0,83 y una sólida relación de ganancias/pérdidas de 2,88. Sin embargo, esta variación estructural requiere una interpretación cuidadosa: este elevado ratio de Sharpe se obtuvo a costa de la rentabilidad absoluta, lo que generó el beneficio neto más bajo ($36 680) entre las configuraciones evolutivas rentables. Además, cuando se combinó con un objetivo de rentabilidad bruta (GA_ORB_ret+SL+TP), la arquitectura obtuvo un rendimiento significativamente inferior, registrando un ratio de Sharpe negativo de -0,23.
Más que una “paradoja Take-Profit” definitiva, estos resultados contradictorios ponen de relieve una interesante divergencia en la microestructura entre los mercados de EMD y TXF. Si bien Wu et al. (2021) observaron que las operaciones de toma de beneficios truncaban las principales tendencias alcistas en Taiwán, el entorno de las empresas de mediana capitalización estadounidenses sugiere que la conservación proactiva de beneficios mediante retrocesos dinámicos puede servir como un método alternativo de control de la volatilidad, aunque su ventaja estadística sigue sin estar demostrada, dado el reducido tamaño de la muestra del modelo y el hecho de que los costes de transacción no se tuvieron en cuenta en este estudio de referencia.
Repensar la optimización: una herramienta de investigación de mercado
Este ejercicio de replicación pone de relieve un valioso cambio de paradigma para el trading sistemático: la optimización no es simplemente una búsqueda, basada en la mecánica, de un conjunto de parámetros de alto rendimiento, sino una ventana eficaz a la investigación de la microestructura del mercado. Al analizar exactamente hacia dónde converge de forma agresiva un motor genético, podemos obtener una visión clara de las características de negociación únicas de un activo. Desde esta perspectiva evolutiva, la optimización de parámetros funciona como una lente de diagnóstico, más que como un simple conjunto de datos de negociación estáticos.
Desde esta perspectiva, los cambios estructurales que el motor genético impuso al modelo taiwanés original resultan muy instructivos. La decisión algorítmica de reducir los umbrales de entrada durante la fase «ingenua» puede interpretarse como una adaptación a la dinámica operativa de los índices estadounidenses modernos. Al reducir los límites, el algoritmo se adapta para captar el impulso intradía temprano desde lo más profundo del rango. Del mismo modo, el rechazo persistente del parámetro de stop-loss estricto (TSL) en la optimización de Sharpe actúa como una advertencia empírica sobre la acumulación de ruido intradía; demuestra que los stops rígidos, escalados en función de la volatilidad, suelen generar pérdidas prematuras, al no permitir que las operaciones con alta convicción dispongan del margen de maniobra necesario. Del mismo modo, el comportamiento contrastado, ajustado al riesgo, de la salida basada en el retroceso (RDD) entre los dos entornos sugiere que la eficiencia del mercado y el ruido de los activos alteran significativamente la gestión de las operaciones. Esto sirve como recordatorio empírico de que los mecanismos de recogida de beneficios dependen en gran medida del mercado, en lugar de ser reglas de aplicación universal.
El panorama general: qué significa esto para nosotros
Ultimately, la finalización de este proyecto de validación pone de manifiesto lo que se puede lograr cuando se utiliza
StrategyQuant X es un laboratorio cuantitativo de alto nivel, más allá de un mero generador automatizado de estrategias. Gestionaba con precisión un enorme espacio de parámetros y estructuras de ventanas móviles históricas. Para los operadores sistemáticos, funciona como un potente filtro de la realidad, eliminando las conjeturas discrecionales y obligando al investigador a crear entornos de ejecución explícitos y basados en reglas, en los que cada variable debe estar matemáticamente justificada. Los resultados empíricos aportan pruebas sólidas de que la dinámica del mercado varía según las microestructuras; no podemos limitarnos a copiar y pegar el diseño de una estrategia de un mercado a otro y esperar un rendimiento idéntico. En su lugar, se necesitan herramientas evolutivas basadas en datos para adaptar nuestra lógica al ruido y a la estructura específicos del activo concreto con el que se opera.
Conéctate, participa en los debates y descargas
Tanto si quieres comentar las formulaciones matemáticas del artículo completo, debatir los resultados sobre la microestructura de los índices estadounidenses o aportar ideas sobre cómo adaptar este marco a otros activos, no dudes en ponerte en contacto conmigo. Puedes escribirme directamente a [email protected] o ponte en contacto conmigo a través de mi Perfil de LinkedIn.
Además, puedes consultar las tablas completas de verificación estadística y los mapas de implementación en el artículo completo, y descargar a continuación la arquitectura de la estrategia lista para ejecutarse:
Optimización evolutiva de una estrategia intradía: un enfoque basado en algoritmos genéticos para la ruptura del rango de apertura en los mercados de mediana capitalización de EE. UU. (1)
Modelo evolutivo basado en ORB con estrategias de cierre protectoras
Descargar la estrategia completa de AlgoWizard (.sqx)