


 Inglés
 Portugués
 Francés
 Italiano
 Alemán
 japonés
Documentación
Aplicaciones
Last updated on 14. 9. 2026 by Libor Stepan
COT data
Contenido de la página
Step 1: Download the COT data
Ir a Gestor de datos -> Indicadores externos and click on Update COT.
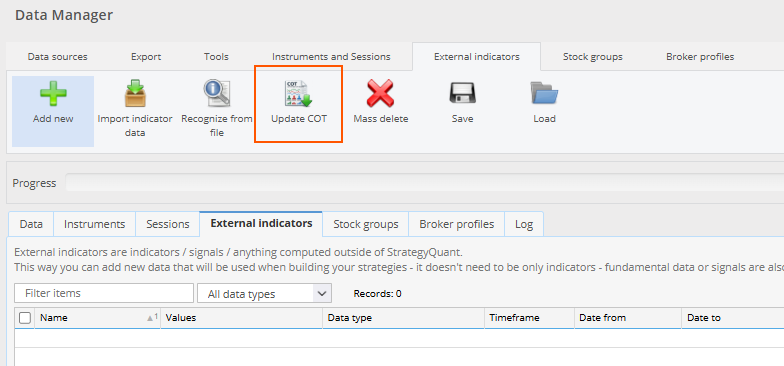
The Update COT button on the External indicators tab. Records: 0 means no COT data has been downloaded yet.
A dialog opens with information about the data and its source. Click Update COT to start.
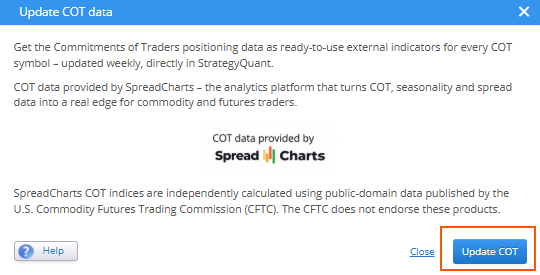
The dialog explains where the data comes from. The Help button opens this page.
The download takes a while — StrategyQuant downloads the reports and rebuilds every series. When it finishes, the new series are listed on the Indicadores externos tab with their real date ranges.
¡Atención!
COT data is a licensed service. You need a valid StrategyQuant license — trial or full — both for this update and for the downloaders on MetaTrader, NinjaTrader and MultiCharts described in Step 4.
What gets created
StrategyQuant creates two external indicators for each COT market — one for each normalization window — 182 series in total:
COT 6E 52W  CME Euro FX
COT 6E 156W CME Euro FX
The name is built from four parts, and every one of them tells you something:
- COT — the prefix all these series share, so they group together in the list
- 6E — the futures symbol of the market the report covers, as the CFTC reports it. 6E is the Euro, GC gold, CL crude oil, ZC corn, VX VIX futures
- 52W o 156W — the normalization window: one year or three years of history
- CME Euro FX — the exchange and the contract in plain words, so you can tell ZW (CBOT SRW Wheat) from KE (CBOT KC HRW Wheat) without looking up the ticker
¡Atención!
The COT blocks find their data by this name — they look for the series that starts with COT, your symbol and the window, for example COT 6E 156W. Do not rename these series; if you do, the blocks stop finding them.
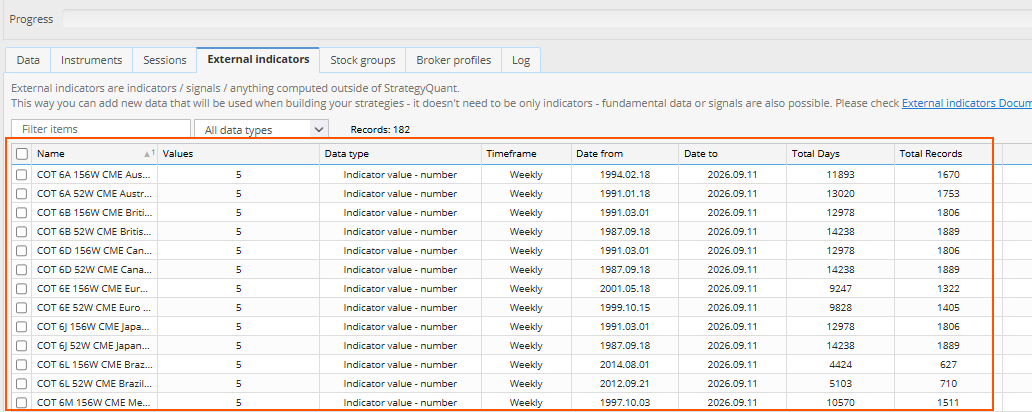
Every COT series is a weekly indicator with five values. The date ranges show how much history each contract has — currencies and grains go back to the late 1980s or early 1990s.
Every series carries five values for each weekly observation:
- cpihedg (value 0) — commercial hedgers, Commitment Percentile Index
- ctihedg (value 1) — commercial hedgers, traders/participation index
- cpispec (value 2) — large speculators, Commitment Percentile Index
- ctispec (value 3) — large speculators, traders/participation index
- cpismall (value 4) — small (non-reportable) traders, Commitment Percentile Index — positions below the CFTC reporting threshold. Often used as a proxy for smaller players, but the CFTC does not identify them as retail
You can work with these series like with any other external indicator, but in normal use you don’t have to — the COT blocks find the right series for you.
Which markets are covered
95 futures markets in total:
- Grains — ZC, ZS, ZL, ZM, ZW, KE, MW, RS, ZR, ZO
- Energía — B, CL, NG, RB, HO, G, T
- Metales — GC, SI, HG, PL, PA, ALI, HRC
- Suaves — SB, KC, CC, CT, OJ, LBR, LB, W, RC, C
- Meats — LE, HE, GF
- Dairy — DA, CSC, CB, NF, GDK, DY
- Broad indices — VX, ES, NQ, YM, RTY, RSG, RSV, EMD, MME, MFS, NIY, NKD, AW
- Sector indices — XAZ, XAP, XAE, XAF, XAV, XAI, XAB, XAR, XAK, XAU, RX
- Tipos de interés — SR1, SR3, GE, ZQ, ZT, ZF, ZN, TN, ZB, UB
- Currencies — DX, 6E, 6J, 6B, 6S, 6A, 6D, 6M, 6N, 6L, 6Z, 6R
- Cripto — BTC, MBT, ETH, MET, SOL, XRP
The history is not equally long for every contract — crypto futures have much less data than grains or currencies. Check the Date from column on the External indicators tab before you rely on a 156-week window.
Where the data comes from
COT indices in StrategyQuant are provided by SpreadCharts, and are independently calculated from public-domain reports published by the CFTC. The CFTC does not endorse these products.
The CFTC publishes on Friday afternoon US time, and the report describes positions held on the preceding Tuesday. A fresh COT observation therefore always describes a market state that is a few days old. This delay is a property of the report itself, not of StrategyQuant.
¡Atención!
The timestamps in the series are Fridays — the publication dates, not the Tuesday position dates. That is the alignment you want: a strategy sees each observation only from the day it was actually public. Had the series been stamped with position dates, every backtest would have received institutional positioning three days early, which inflates results without looking like an error.
Step 2: Understand what the values mean
CPI — Commitment Percentile Index
CPI answers one question: where is the current net position of this group within its own historical range? The range is 0 to 100.
- CPI above 80 — the group is near the top of its historical net-long range
- CPI between 40 and 60 — a neutral zone with little information
- CPI below 20 — the group is near the bottom of its range, at its most net-short
The classic interpretation compares two groups against each other:
- hedger CPI high together with speculator CPI low — a bullish positioning divergence
- hedger CPI low together with speculator CPI high — a bearish positioning divergence
The reasoning behind it is that large speculators (managed money, hedge funds) are trend followers, and tend to be most crowded exactly at turning points, while commercials are on the other side of those trades.
¡Atención!
Treat this as a hypothesis you should test, not as a rule. Commercials are hedgers, not forecasters. A high hedger CPI describes how they are positioned, it does not promise a price move.
CTI — traders/participation index
CTI is a normalized index of trader participation in a category. It is not price momentum and it has no assumed direction. Use it as a secondary, contextual value.
Normalization window — 52w or 156w
Every series exists in two versions:
- 156w (about three years) is the default and the recommended starting point. It is slower and more structural.
- 52w (one year) reacts faster. It is a separate hypothesis, not an improvement — test it on its own instead of assuming that a faster reaction is better.
You choose the window in the Periodo parameter, but only 16 blocks have one: ten of the eleven numeric indicators, plus the four Full-Cycle signals and the two VIX Proxy signals. The remaining blocks have their windows fixed by their own logic — COT Bullish Extreme, for example, tests the 52-week window and can confirm it against the 156-week one, and (COT) Composite Score always combines both.
The warm-up is already taken care of in the data: for every market the 156w series starts later than the 52w one, because the longer window needs more history before it can be normalized. In gold the difference is about three and a half years (52w from 1987, 156w from 1991), in the Euro and in Bitcoin about a year and a half. What you have to watch is the other end: do not start your test before the series itself starts, or the blocks return 0.
Step 3: Use COT data in a strategy
There are two ways to work with COT data, and they serve different purposes.
The COT blocks are ready-made indicators and signals. They resolve the right COT market for your chart instrument on their own, and the signal blocks already contain the positioning logic. This is what you normally want.
The external indicators give you the raw series. You pick the market and the field yourself, which is useful when you want to build your own rule or feed a value into a formula.
Using the external indicators directly
En Add Condition open the Indicadores group and scroll down to External Indicators. Every downloaded COT series is listed there under its full name.
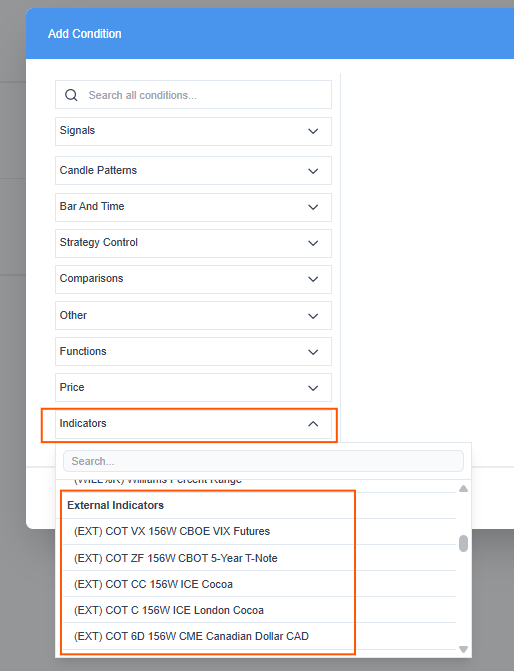
Each series appears as (EXT) COT <symbol> <window> <exchange and market>.
After you pick one, the block has two parameters. Turno works as everywhere else, and Línea selects which of the five values you want to read.
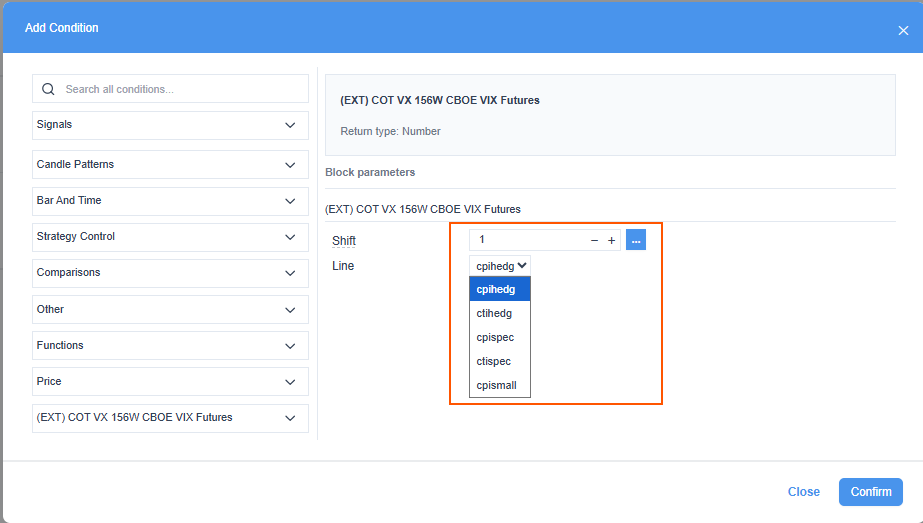
The Line parameter exposes all five COT fields — cpihedg, ctihedg, cpispec, ctispec and cpismall.
¡Atención!
The series store the values on a 0 to 1 scale — a hedger CPI of 0.90 here is the same reading the (COT) Hedger CPI block shows as 90. The external indicator also has no AUTO resolution: you choose the market by picking the series, so a strategy built this way is tied to that one COT market. If you want the block to follow the traded instrument, use the COT blocks below.
Using the COT blocks
The COT blocks sit among the standard building blocks, in two places. The numeric ones are in Indicadores, listed alphabetically as (COT) …:
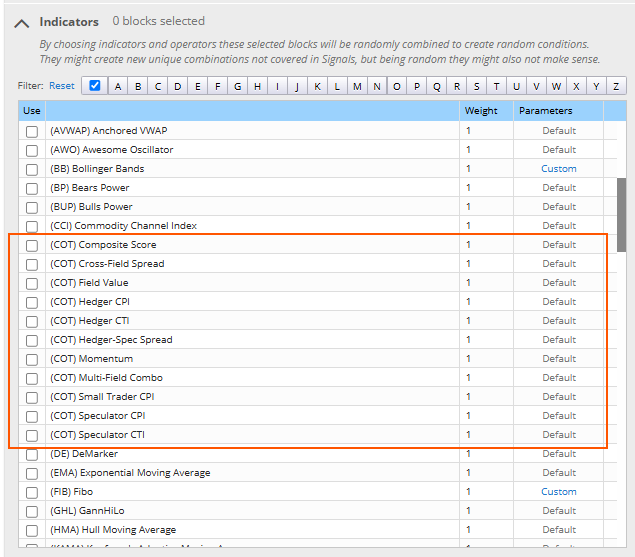
All eleven numeric COT blocks, between Commodity Channel Index and DeMarker.
The signals are in Signals (Predefined conditions), grouped together under a COT heading:
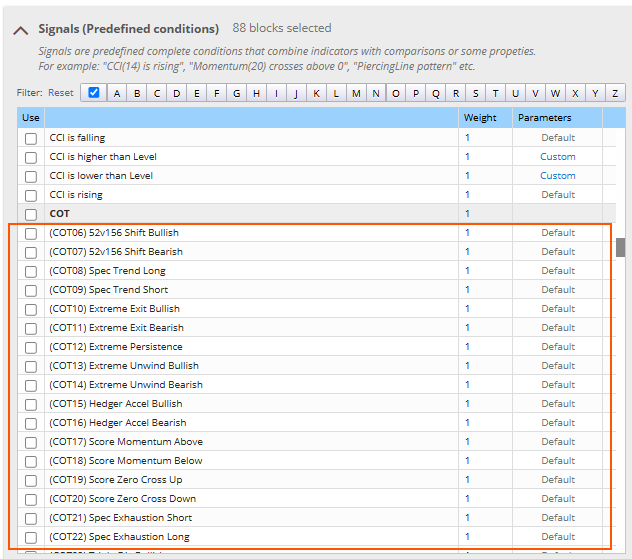
Signal blocks sit together under a COT heading. Most of them carry a number in the name, which keeps them in a fixed order in the list.
You will find the same lists in Ajustes completos -> Bloques de construcción when you set up a Builder task. COT blocks are not selected by default, so if you want the Builder to use them, tick them there first — otherwise no generated strategy will ever contain a COT rule.
¡Atención!
Names in the two lists follow different conventions. Numeric blocks are (COT) Hedger CPI, (COT) Momentum and so on. Signals are either numbered — (COT13) Extreme Unwind Bullish — or named directly, such as COT Bullish Extreme o COT VIX Proxy Bullish.
Numeric indicators (11 blocks)
These return a value on every bar, so you can compare them, cross them, rank with them or use them as machine-learning features.
The five raw fields are available as (COT) Hedger CPI, (COT) Hedger CTI, (COT) Speculator CPI, (COT) Speculator CTI y (COT) Small Trader CPI. All of them return 0 to 100.
Two derived blocks combine them:
- (COT) Composite Score returns -1 to +1 and is computed as avg(hedger52, hedger156) – avg(spec52, spec156). Because it uses both windows, it has no Periodo parameter. It is a compact regime score: above +0.60 a strong bullish divergence, +0.20 to +0.60 a moderate bullish lean, -0.20 to +0.20 neutral, below -0.60 a strong bearish divergence.
- (COT) Hedger-Spec Spread returns -100 to +100 and is simply hedger CPI minus speculator CPI — a direct measure of how much the two groups disagree.
Four more blocks exist mainly for research and for machine-learning feature sets:
- (COT) Momentum — the change over N weekly COT observations
- (COT) Field Value — a generic accessor, you pick the field with FieldIndex (0 = cpihedg, 1 = ctihedg, 2 = cpispec, 3 = ctispec, 4 = cpismall)
- (COT) Cross-Field Spread — the difference between any two fields you select
- (COT) Multi-Field Combo — an average of selected bullish-oriented fields: hedger CPI counts as it is, while speculator CPI, small trader CPI and speculator CTI are inverted. Each of the four has its own on/off switch, so you can remove one at a time and see what it contributes
If you want to give an ML model the complete field set, add (COT) Field Value five times with FieldIndex 0 to 4.
Signal blocks (57 blocks)
Signal blocks return true or false, and each one implements a documented positioning idea. Here is the complete list as it appears in StrategyQuant.
Named signals
- COT Bearish Extreme — Hedger vs Speculator Extreme Reversal (Bearish)
- COT Bullish Extreme — Hedger vs Speculator Extreme Reversal (Bullish)
- COT Crowding Unwind
- COT Emergency Exit Long — Price-based safety exit for COT cycle strategies
- COT Full-Cycle Exit Long
- COT Full-Cycle Exit Short
- COT Full-Cycle Long Entry
- COT Full-Cycle Short Entry
- COT Score Above — Composite Score above a threshold (Bullish regime)
- COT Score Below — Composite Score below a threshold (Bearish regime)
- COT VIX Proxy Bearish — Uses VIX futures COT instead of direct index COT for equity index trading. Always reads VX, whatever COT symbol you set
- COT VIX Proxy Bullish — Uses VIX futures COT instead of direct index COT for equity index trading. Always reads VX, whatever COT symbol you set
Numbered signals
- (COT06) 52v156 Shift Bullish — 52w vs 156w Positioning Shift (Bullish)
- (COT07) 52v156 Shift Bearish — 52w vs 156w Positioning Shift (Bearish)
- (COT08) Spec Trend Long — Speculator Trend Following (Long)
- (COT09) Spec Trend Short — Speculator Trend Following (Short)
- (COT10) Extreme Exit Bullish
- (COT11) Extreme Exit Bearish
- (COT12) Extreme Persistence
- (COT13) Extreme Unwind Bullish
- (COT14) Extreme Unwind Bearish
- (COT15) Hedger Accel Bullish — Hedger Acceleration (Bullish)
- (COT16) Hedger Accel Bearish — Hedger Acceleration (Bearish)
- (COT17) Score Momentum Above — COTScore Momentum Above threshold
- (COT18) Score Momentum Below — COTScore Momentum Below negative threshold
- (COT19) Score Zero Cross Up — COTScore Zero Cross Up
- (COT20) Score Zero Cross Down — COTScore Zero Cross Down
- (COT21) Spec Exhaustion Short — Speculator Exhaustion (Short signal)
- (COT22) Spec Exhaustion Long — Speculator Exhaustion (Long signal)
- (COT23) Triple Div Bullish — Triple Positioning Divergence (Bullish)
- (COT24) Triple Div Bearish — Triple Positioning Divergence (Bearish)
- (COT25) Higher Low (COT Div) — COT Higher Low (Institutional Divergence)
- (COT26) Lower High (COT Div) — COT Lower High
- (COT27) Accumulation Bullish
- (COT28) Accumulation Bearish — Distribution (Bearish)
- (COT29) Smart vs Dumb Bullish — Smart vs Dumb Money (Bullish)
- (COT30) Smart vs Dumb Bearish — Smart vs Dumb Money (Bearish)
- (COT31) Neutral Zone — Filter
- (COT32) Small Fade Bullish — Small Trader Fade (Bullish)
- (COT33) Small Fade Bearish — Small Trader Fade (Bearish)
- (COT34) Spread ZScore Bullish
- (COT35) Spread ZScore Bearish
- (COT36) ROC Bullish — Rate of Change (Bullish)
- (COT37) ROC Bearish — Rate of Change (Bearish)
- (COT38) H/S Convergence — Hedger/Speculator Convergence filter
- (COT39) Regime Shift Bullish — Rapid Regime Shift (Bullish)
- (COT40) Regime Shift Bearish — Rapid Regime Shift (Bearish)
- (COT41) Seasonal Bullish — Seasonal Filter (Bullish)
- (COT42) Seasonal Bearish — Seasonal Filter (Bearish)
- (COT43) Momentum Rev Bullish — Momentum Reversal (Bullish)
- (COT44) Momentum Rev Bearish — Momentum Reversal (Bearish)
- (COT45) Multi-Window Bullish — Multi-Window Confirmation (Bullish)
- (COT46) Multi-Window Bearish — Multi-Window Confirmation (Bearish)
- (COT47) Score Accel Bullish — Score Acceleration (Bullish)
- (COT48) Score Accel Bearish — Score Acceleration (Bearish)
- (COT49) Hedger Div Confirmed Bull — Hedger Divergence Confirmed (Bullish)
- (COT50) Hedger Div Confirmed Bear — Hedger Divergence Confirmed (Bearish)
Every block has its own help text in StrategyQuant explaining what it measures, what the thresholds mean, and which strategy from the COT SQX Strategies Guide it implements. You see it as soon as you select the block, above its parameters.
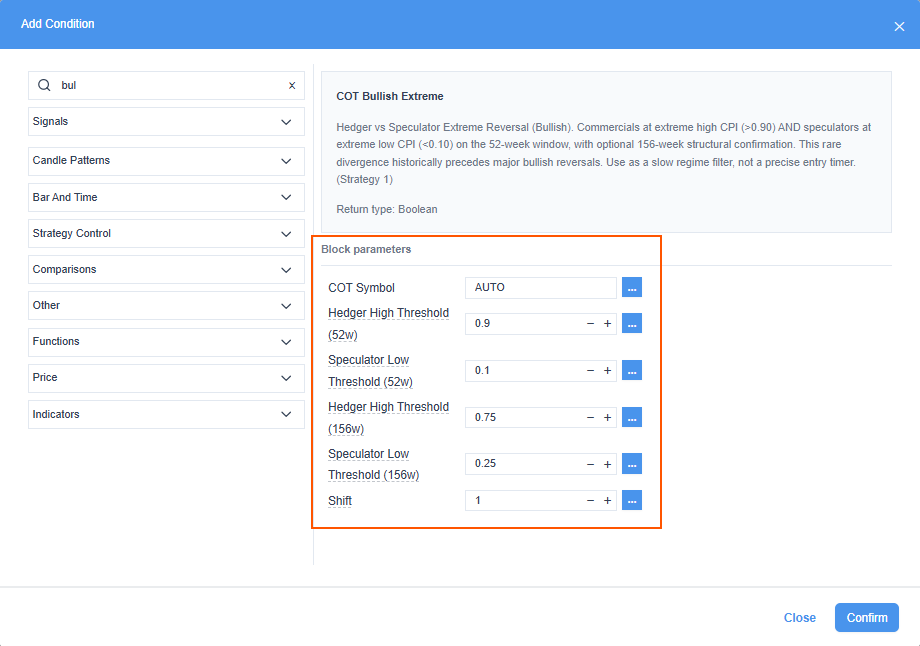
COT Bullish Extreme with its default thresholds. Note the scale: the parameters are 0.9 and 0.1, not 90 and 10.
A typical rule pairs the COT block with price logic — COT gives permission, price decides the entry:
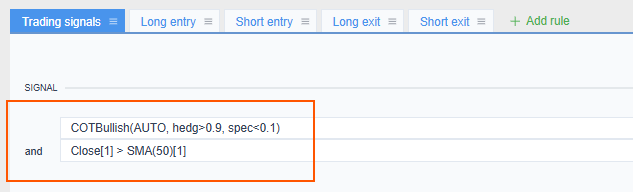
The same condition in a strategy: the COT block must be true and price above its moving average.
COT Symbol — which market the block reads
Every COT block has a CotSymbol parameter with three possible settings.
AUTO (the default) resolves the COT market from the chart instrument. StrategyQuant removes broker decorations from the symbol — suffixes and prefixes like micro, mini, CFD o ECN, and characters like dots and dashes — and then matches it against an alias table: 126 aliases pointing at 54 COT markets. EURUSD y EUR resolve to 6E, XAUUSD y ORO a GC, US500 a ES, NAS100 a NQ, and so on. The resolved symbol is written into the strategy, so it stays the same from then on.
Note that the table covers 54 of the 95 downloaded markets. The rest — the sector indices, the dairy contracts and the less common rates — have data but no alias, so AUTO will not find them. Select those by symbol.
RAND picks a random COT market out of those same 54 mapped ones. Use it in generating and research runs where you want the builder to try different positioning sources.
A specific symbol - 6E, CL, VX and so on — is used for cross-market work, for example when you want to read VX (VIX futures) positioning inside a strategy that trades an equity index.
¡Atención!
If AUTO cannot find a mapping for your instrument, or the series is missing, the block writes the reason into the log and switches itself off. A signal block then returns false and the strategy simply never enters. A numeric block returns 0 — and since 0 is the bottom of the 0-to-100 range, a missing series reads exactly like an extreme net-short position. If a COT strategy takes no trades, or shows a suspiciously permanent extreme, check the log first.
Watch the scales
Numeric blocks and signal parameters use different scales, and this is the most common mistake:
- numeric indicators (CPI, CTI, Field Value, Multi-Field Combo) return 0 a 100, so you compare them against 80 or 20
- Composite Score returns -1 to +1
- spreads and momentum return -100 to +100
- parameters inside signal blocks are usually on the normalized 0 to 1 scale, so you enter 0.90 or 0.10
In other words, a comparison against (COT) Hedger CPI uses 80, while the Hedger High Threshold parameter in COT Bullish Extreme uses 0.90. Both mean the same thing. Always follow the range StrategyQuant shows for the parameter.
Weekly data on a daily or intraday chart
COT is weekly data, but you can use it on D1, H4, H1 or intraday strategies. Three things follow from that.
Which chart should the strategy run on? COT is weekly data, and a weekly chart is the setup everything was designed around: one bar is one report, the lookback parameters named in weeks then really mean weeks, and the value changes on every bar.
Each block resolves its value by timestamp — it keeps the weekly observations sorted and returns the last one whose timestamp is lower than or equal to the current bar time — so the same weekly value repeats across many bars on a lower timeframe. That is expected, not an error.
The raw series are a different story. Like every external indicator in StrategyQuant, they are valid only for the timeframe they were imported for — and COT is weekly. In the Builder they therefore appear only while a weekly timeframe is selected in Ajustes -> Datos; switch to D1 and they disappear from the list. (There is a Show all external indicators (also for not-matching Timeframes) checkbox in the building-blocks panel, but that only changes what is offered, not what the data is.)
So on a D1 strategy the raw series are not available at all — you either use the COT blocks, or add a weekly subchart and take the series from there.
¡Atención!
Whichever route you take, verify on your own data that the block returns real values before you read anything into a backtest. A block that cannot resolve its series returns 0, and 0 is a valid-looking reading at the bottom of the scale, not an error message.
There is one edge to know about: if a bar falls before the first COT observation in the series, the lookup returns 0 — see the warning about missing data above. One more reason to start the test after the warm-up.
A later weekly observation is never attached to an earlier bar, so there is no lookahead. Missing reports and holidays reuse the last known value, StrategyQuant does not invent a new observation.
Lookbacks are counted in chart bars, not in COT reports — and this catches people out, because several parameters are named in weeks. Min Consecutive Weeks, ShiftWeeks o Búsqueda retrospectiva are all read as a number of bars on the chart your strategy runs on.
On a weekly chart one bar is one COT report and the names match. On a daily chart they do not: four bars are four trading days, which is usually still the same weekly observation, so (COT) Momentum with its default lookback of 4 returns zero most of the time. If you work on D1, use roughly 5 bars for one week and 20 for one month; on H1 the numbers grow accordingly.
¡Atención!
A weekly subchart has one more advantage: lookbacks counted on it are weekly bars again, so a parameter named in weeks finally means weeks.
Step 4: Export and live trading
COT strategies are not limited to StrategyQuant. Generated code carries the COT logic to your platform, where a downloader keeps a local copy of the same data. All platform files are in the custom_indicators folder in your StrategyQuant installation.
COT blocks are generated for MetaTrader 4, MetaTrader 5, NinjaTrader 8, TradeStation/MultiCharts and PseudoCode. They are not generated for JForex.
MetaTrader 4 and MetaTrader 5
A generated COT strategy has its own inputs — COTLicenseCode (your StrategyQuant or QuantDataManager license number), COTServerUrl and the retry settings. Fill in the license code, otherwise the strategy will not trade.
In live trading the EA downloads the data itself, on the first ticks after it starts, and refreshes it when a new weekly record is due. You have to allow the server URL in Herramientas -> Opciones -> Expert Advisors -> Allow WebRequest for listed URL; by default it is https://api.strategyquant.com. Everything the EA downloads is also written into the common Files folder as SQ_COT_<identifier>.csv, for example SQ_COT_6A_52w.csv.
¡Atención!
WebRequest does not work in the Strategy Tester — this is a MetaTrader limitation. The tester can only read the CSV cache, so the cache has to exist before you run a backtest.
There are two ways to create it:
- Run the strategy once on a live or demo chart and let it download the data.
- Ejecuta el SqCOTDownloader script from the Guiones folder: drop it on any chart, fill in your license number, optionally list the identifiers you want (6A_52w,ZC_156w; leave empty for all) and run it.
If the cache is missing, the strategy does not trade and writes the reason into the log.
The installation also contains a standalone SqCOTDownloader EA in the Experts folder, for keeping the cache updated continuously. It downloads a ZIP archive from the StrategyQuant CDN and writes the CSV files into MQL5/Files/SqCOT/. Because it unpacks an archive, it needs both Allow WebRequest para https://cdn.strategyquantcdn.com y Allow DLL imports.
NinjaTrader 8
Add the SqCOTDownloader indicator to any chart and enter your license key in its properties. It downloads the data and builds a binary cache in Documents\NinjaTrader 8\SqCOT\, which the SqCOT indicator and your generated strategies then read. The downloader checks for updates periodically, so you can leave it running.
TradeStation and MultiCharts
Generated EasyLanguage code calls SQ_COT_GetValue(…) and reads the cache from C:\SQ_COT\. In MultiCharts you also have to install the two DLLs from custom_indicators\Tradestation\DLL (Multicharts only).
Before you trust a backtest
Check these points before you draw conclusions from a COT strategy:
- The COT update finished and the series are visible in Gestor de datos.
- The last COT date is current and the history covers your whole test period.
- Your test starts after the series does — check Date from for the exact market and window you use.
- AUTO resolved to the futures market you intended. Verify it for broker suffixes, CFDs and spot FX symbols.
- Thresholds are written on the correct scale — 80, not 0.80.
- Lookback parameters are set in chart bars — on D1 a “4-week” idea needs about 20, not 4.
- On the export platform the downloader ran and the cache is in place.
Solución de problemas
The strategy takes no trades at all. A COT block that cannot resolve its series returns 0, which is a valid-looking value at the bottom of the scale — not an error. Check three things: the series for your symbol and window exists on the Indicadores externos tab; your test period starts after that series’ Date from; and AUTO resolved to the market you expected. The log records the reason when a block switches itself off.
A COT indicator reads 0 for the whole backtest. Same cause as above, and one more candidate: the test starts before the first COT observation for that market. A 156w series begins later than the 52w one — in Bitcoin it is 2020, in gold 1991.
AUTO picks nothing, or picks the wrong market. The alias table covers 54 of the 95 downloaded markets, and broker symbols vary. Set CotSymbol manually — that is also the right move for CFDs, spot FX and any cross-market use.
A comparison never triggers. Check the scale. Numeric blocks return 0 to 100, so the threshold is 80. Parameters inside signal blocks are on the 0-to-1 scale, so there it is 0.90.
(COT) Momentum is always zero. Its lookback counts chart bars. On D1, four bars are four days — usually the same weekly observation, so the change is zero. Use about 5 bars for a week, 20 for a month, or run the strategy on a weekly chart.
The COT series are missing from the block list. External indicators only appear for their own timeframe, and COT is weekly. Select a weekly timeframe, use a weekly subchart, or use the COT blocks instead.
A generated strategy does not trade on MetaTrader. Two usual reasons: the licence field is empty, or the CSV cache does not exist yet. Run the downloader script once, then the backtest. The strategy writes the reason into the platform log.
What to expect
COT blocks give you a well-documented set of positioning tools, but they are not a shortcut to a profitable strategy. Our own testing across 45 markets, several sectors and a number of filter structures showed:
- simple threshold rules such as COT above 0.90 -> buy did not produce a stable edge across markets
- the full-cycle positioning strategy did not hold up as a standalone strategy
- in several cases better metrics came from filtering away most of the trades, which increases selection bias rather than proving an edge
What the same testing does support:
- COT extremes carry more information than neutral readings
- COT works better as a slow regime filter or a contextual feature than as an entry trigger
- 156w is the better baseline to start from
- COT can add conditional information inside multi-factor or machine-learning models, especially on physical commodities
The fit also differs by market family. Physical commodities (CL, NG, HO, RB) come first, because producer and consumer hedging is real and economically grounded; metals, grains and currencies follow. Equity indices are a weaker fit for direct use, and using VX positioning as a proxy for ES, NQ, YM or RTY is a research idea, not a validated technique.
If you want to claim that COT improved your strategy, test it properly: use identical walk-forward or out-of-sample splits with and without the COT features, remove one COT field at a time to see what it actually contributes, measure stability per instrument instead of pooled results, and account for the trades that the filter removed.
Where to learn more
Two detailed guides are included in the COT folder in the root of your StrategyQuant installation:
- COT Indicators and Signals Reference Guide — all 68 blocks, their scales, parameters and intended use
- COT SQX Strategies Guide — 39 documented positioning strategies with the design rules behind them
See also: Indicadores externos
¿Le ha resultado útil este artículo? El artículo era útil El artículo no era útil