EA Analyzer Portfolio analysis
6 replies

james
9 years ago #113240
Hello
Apologies for the newbie question, but here goes!
I just want to make sure I’ve understood what my result in the following attached screenshot shows:
 Clipboard02.jpg
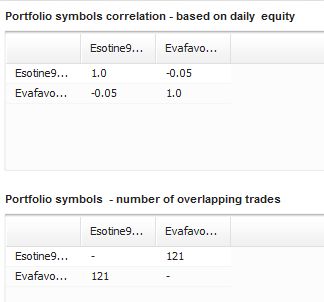
- Esotine9 and Evafavo are uncorrelated on equity
- But are 100% correlated on overlapping trades
Is that correct?
I couldn’t find a specific description of this part of EAA anywhere. Could you point me to it? Is there a user manual for EAA? (Sorry I missed it if there is!)
Thanks,
James.
P.S.
Later edit: Sorry should have said, Evafavo makes 121 trades in total, and Esotine9 377, therefore all of Evafavo’s trades overlap Esotine9’s.
Mark Fric
9 years ago #128700
yes, it looks like this.
Correlation is computed using P/L, so it seems these two strategies are not correlated by profit, but they have 121 trades where at least 1 day is overlapped.
Mark
StrategyQuant architect
james
9 years ago #128711
Mark
Thank you for the reply.
Could I trouble you once more please? You say that the results above show correlation where at least 1 day is overlapped. I was using the H1 timeframe. Does this mean that if one strategy opens and closes within the hour at the start of the day, and the other does the same at the end, then this is counted as an overlap?
Mark Fric
9 years ago #128734
sorry, I made a mistake in the explanation. Overlapping means that the trades overlapped, it means that at least for a while both trades were opened at the same time.
From your example it seems that every trade of Evafavo overlapped with some trade from Esotine9.
Mark
StrategyQuant architect
james
9 years ago #128736
Great! Thank you for clarifying that. 🙂

umbertosm
8 years ago #133296
Hi Mark,
in Portfolio symbol correlation ‘“ based on daily equity
we have Esotine9 – Evafavo = – 0.05
Umberto
umbertosm
8 years ago #133323
OK, thanks, I found the explanation here 🙂
Portfolio correlation explained : https://strategyquant.com/doc/article/portfolio-correlation-explained.html
Viewing 6 replies - 1 through 6 (of 6 total)