Analysing robustness
5 replies

nolube
10 years ago #113354
Just have a few questions about analysing the robustness results.
Firstly here are the settings I’m using..
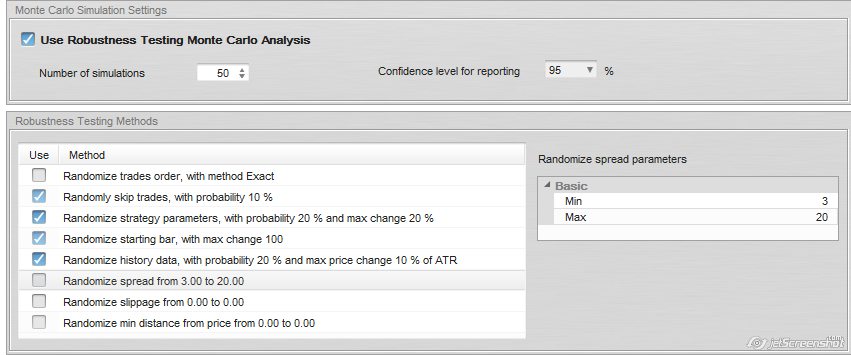 rob settings.jpg
Now when analysing the results, is it better to see the results all nice and close together? Like this..
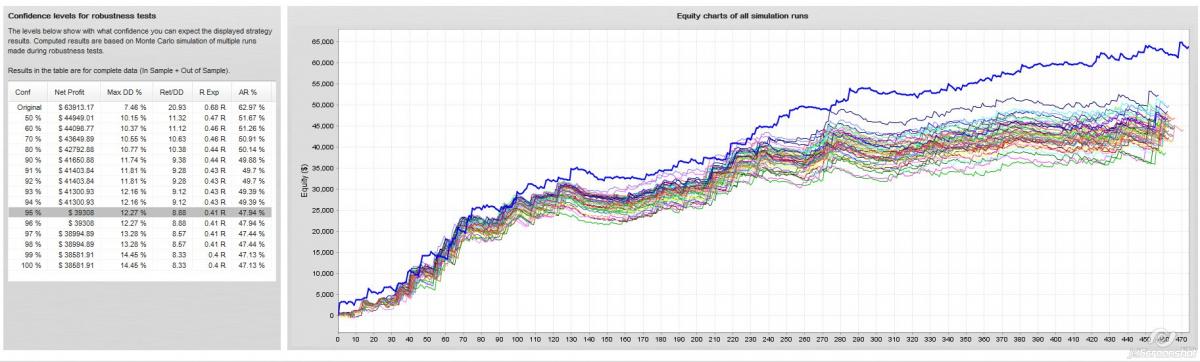 rob results1.jpg
…but does this mean in a way that the results are curve fitted because the original strategy is the best?
Most other results are way more spread out like this..
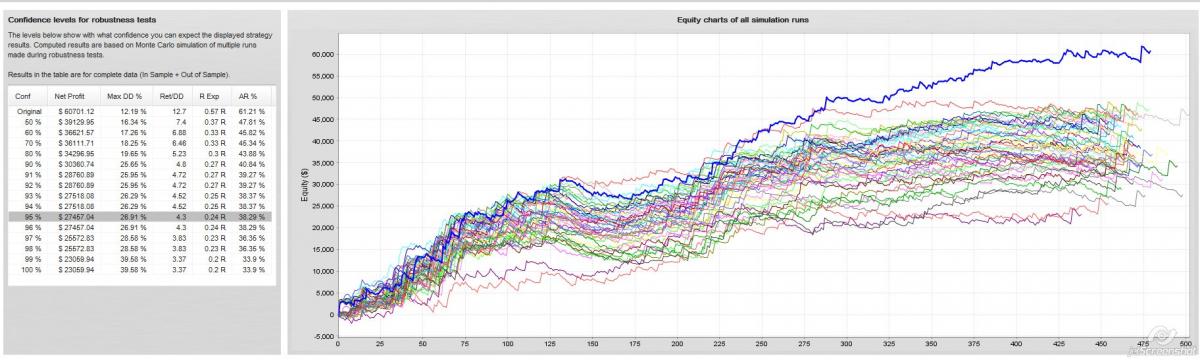 rob results3.jpg
OR, is it better to see the original strategy more towards the middle (mean) of the Robustness results like this?
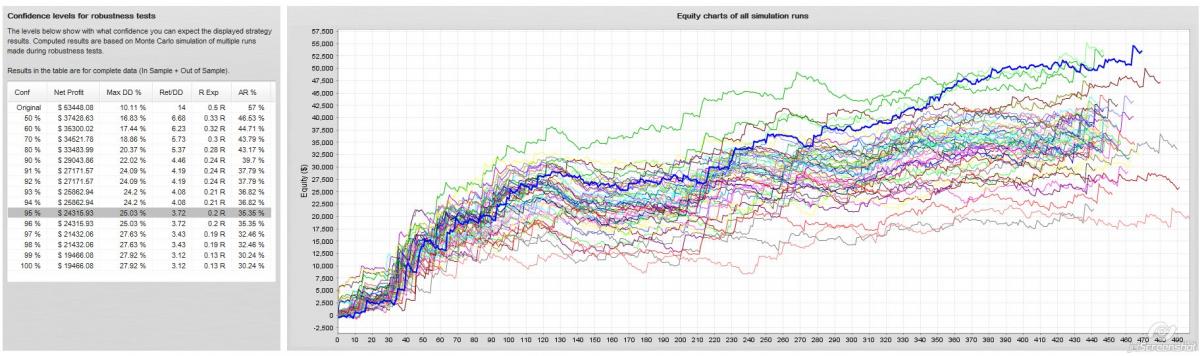 rob results2.jpg
Thanks
Mark Fric
10 years ago #128887
yes, your first image looks like curve fitted strategy, all other monte carlo simulations are much worse.
You can still use this strategy, but expect different (not that good results). You can see the results you can expect in the table.
With 95% probability your results will be around $39000 and not $69000.
Mark
StrategyQuant architect

born_1
10 years ago #130921
Sorry Mark to be back to this post, but It’s not clear to me which one of the above 3 example can be considered as more robust and promisng strategy for future.
From a visual point of view, where do more chance of robustness and working for future sit?? In case where all the MC curves results are all nice and close together (1st image form post) or where those curves are way more spread out (last image)??
thanks
tomas262
10 years ago #130979
Hi,
it’s quite difficult to say which one is more robust. I would personally like to see equities closer to each other (that means changes in input data does not affect strategy that much) with highest Ret/DD ratio and smallest DD. Absolute return is not that important to me. Also WFA analysis is important and I want to see strategy giving “satisfactory” result even during 3 months SIM trading period before I put them into the live market with an initial position size

Matusiak Adrian
10 years ago #131030
True, but as far as I see, the robustness tests are done by Tick method. And Tick method is sometimes way much diffirent than Real Tick method 😉 So, charts look strange. Original strategy curve is 1 thing, and robusts charts are very diffirent due to other method used by tester.

tomas262
10 years ago #131031
One more thing to the original question. I also wouldn’t try to chase a system with perfect looking equity and stats but rather try to build a portfolio of uncorrelated strategies (different trading logic, timeframes and markets/sectors) that provide satisfactory results. That way (and I believe the only as a retail trader) you can achieve long term consistency in profits with automated trading.
Viewing 5 replies - 1 through 5 (of 5 total)