We are adding several new indicators and conditions derived from these indicators into StrategyQuant X Build 130. They are currently implemented for Metatrader 4, Metatrader 5, Tradestation, and Multicharts.
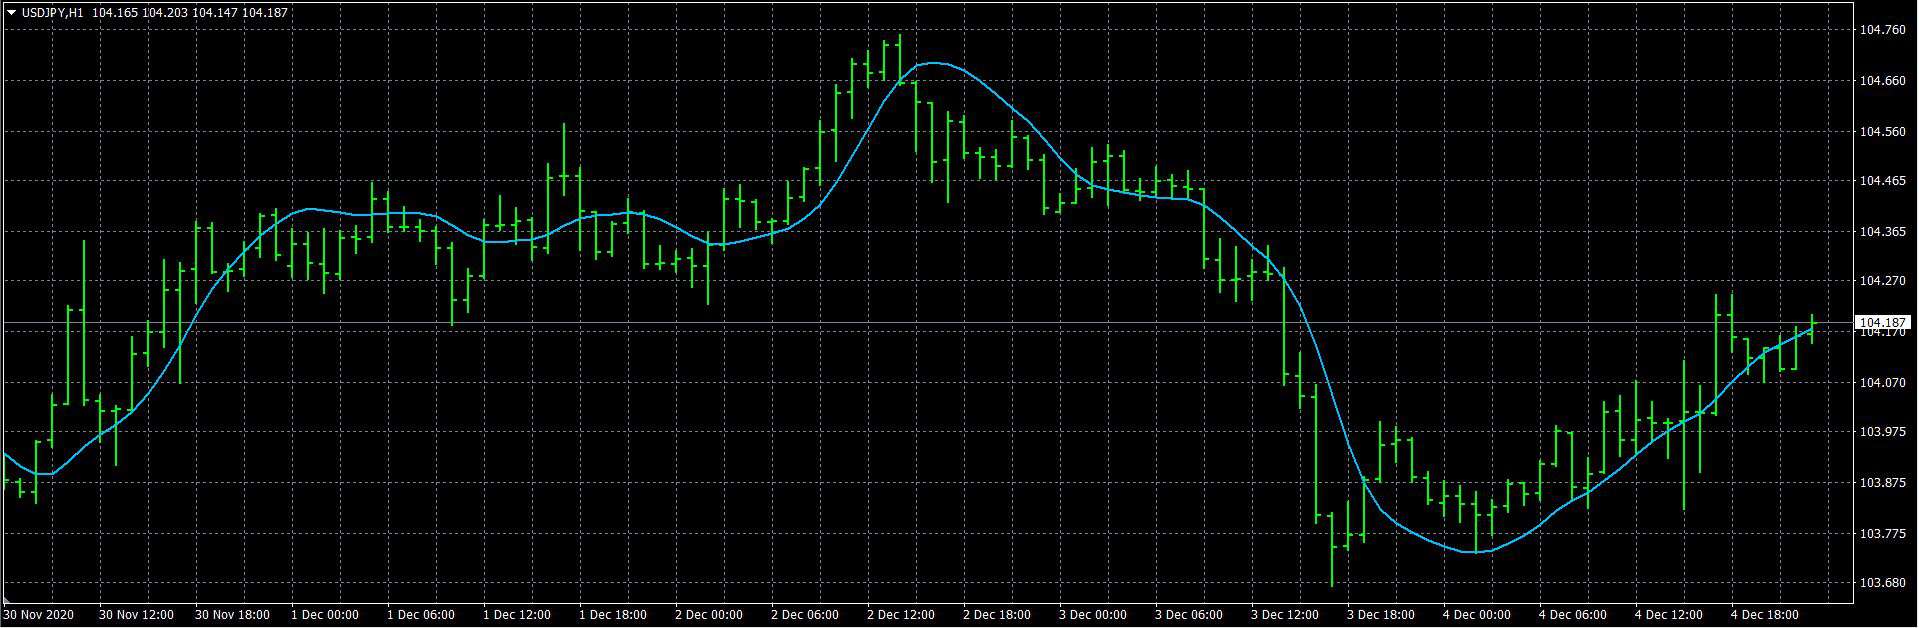
Hull Moving Average ( HMA )
The Hull Moving Average (HMA), developed by Alan Hull, was created to address moving average lag by placing more emphasis on more recent data. It is an extremely fast and smooth moving average. The HMA almost eliminates lag altogether and manages to improve smoothing at the same time. Like all moving averages, the HMA can be used to visualize the trend.
Hull Moving Average is calculated as follows:
Integer(SquareRoot(Period)) WMA [2 x Integer(Period/2) WMA(Price) - Period WMA(Price)]
HMA has one configurable parameter:
Period – Number of bars used for calculation
There are 3 long and 3 short conditions :
- Fast HMA is above/below Slow HMA
- HMA is rising/falling
- HMA changes direction UP/Down
Woodies CCI Patterns
We have added entry patterns of the system developed by Ken Wood. All of these patterns work with the CCI indicator which is the core of the Woodies CCI system.
You can trade these patterns as conditions:
- Woodies CCI Zero Line Break UP
- Woodies CCI Zero Line Break Down
- Woodies Famir UP
- Woodies Fami Down
- Woodies Trend UP
- Woodies Trend Down
- Woodies Vegas Trader Down
- Woodies Vegas Trader UP
- Woodies ZLR Down
- Woodies ZLR UP
For more information about these patterns please follow this guide: Trading-Woodies-CCI-System
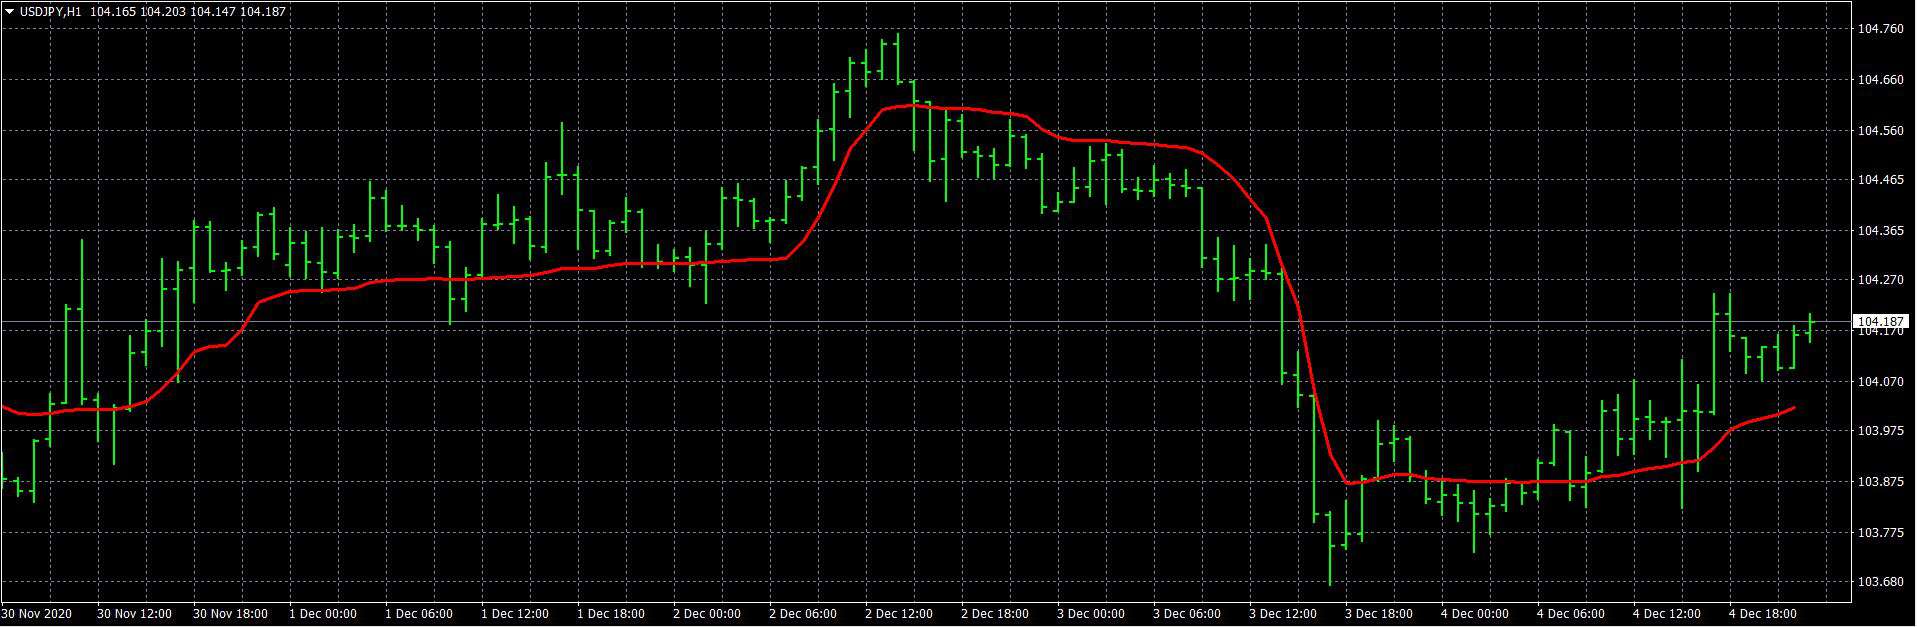
Kaufman Moving Average ( KAMA )
Kaufman Moving Average ( KAMA ) is a type of moving average which accounts not only for price trend but also for market volatility. It closely follows price when noise is low and smooths out the noise when the price fluctuates. Like all moving averages, the KAMA can be used to visualize the trend. If price crosses KAMA it indicates a directional change. Price can also bounce off the KAMA, which can act as dynamic support and resistance.
KAMA calculation is a bit complicated and but you can find more information Here
SQX indicator KAMA has 3 configurable parameters:
- ER period – Number of bars used for calculation of Efficiency Ratio
- Short period – Number of bars used for calculation of fast EMA (FC)
- Long period – Number of bars used for calculation of slow EMA (SC)
There are 3 long and 3 short conditions:
- Bar crosses above/below KAMA
- KAMA Is Rising/Falling
- Fast KAMA is above/below Slow KAMA
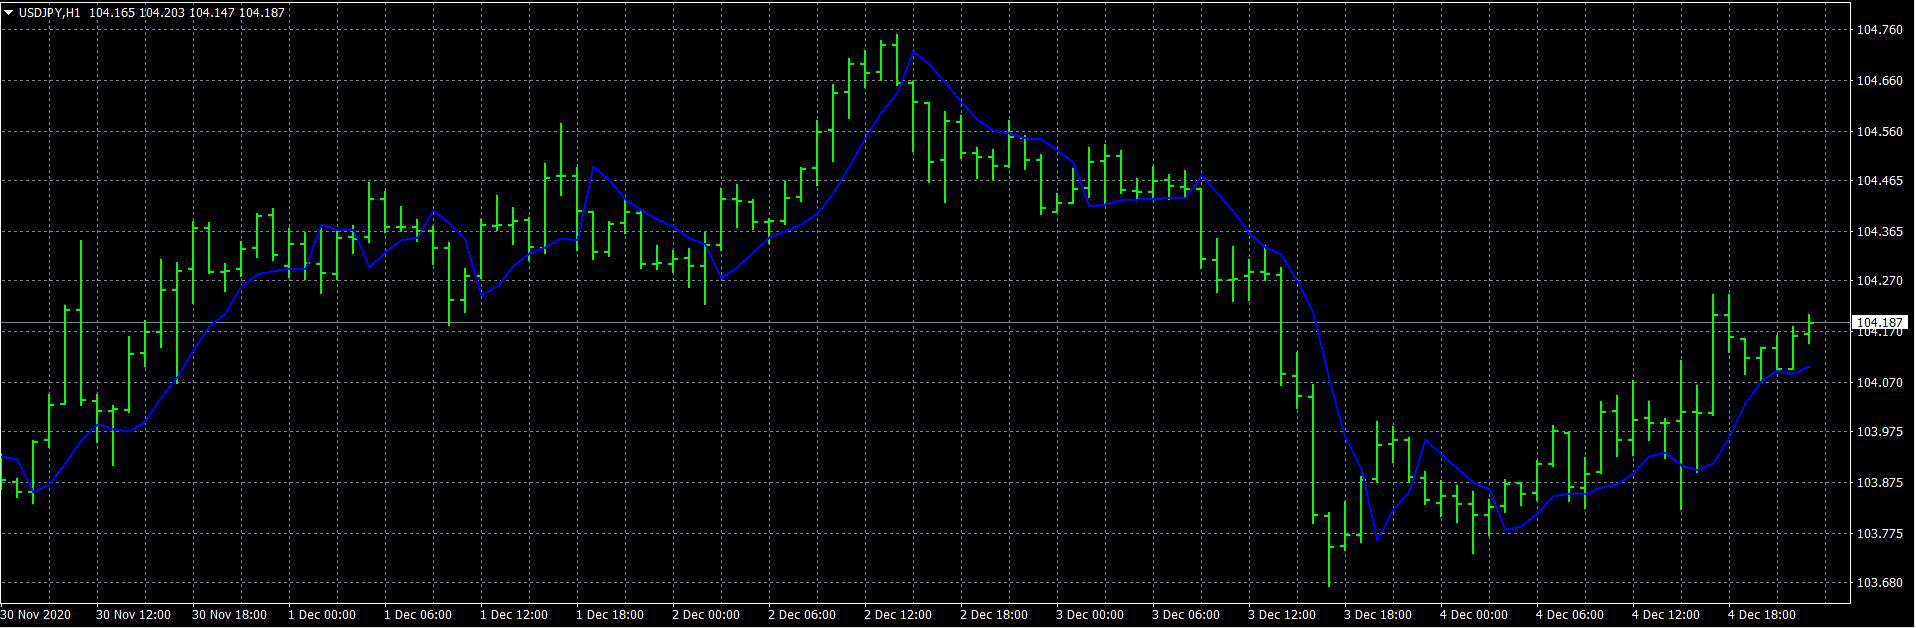
Gann HiLo
Gann HiLo known as Gann HiLo Activator is an indicator that was developed by Robert Krausz. Gann HiLo is a trend-following technical indicator used to help determine the direction of the trend and to generate with-trend entry signals.
The indicator is a simple moving average of the previous X periods of highs or lows. Based on the logic of the moving average, it is a trend-following indicator used to reflect the market’s direction of movement. Gann HiLo can be used for generating entry signals, but it can be used to determine stop-loss levels.
Gann HiLo MA has one configurable parameter:
Period – Number of bars used for calculation
There are 2 conditions:
- GannHiLo is in UP trend ( Close > GannHiLo )
- GannHiLo is in Downtrend ( Close < GannHiLo )
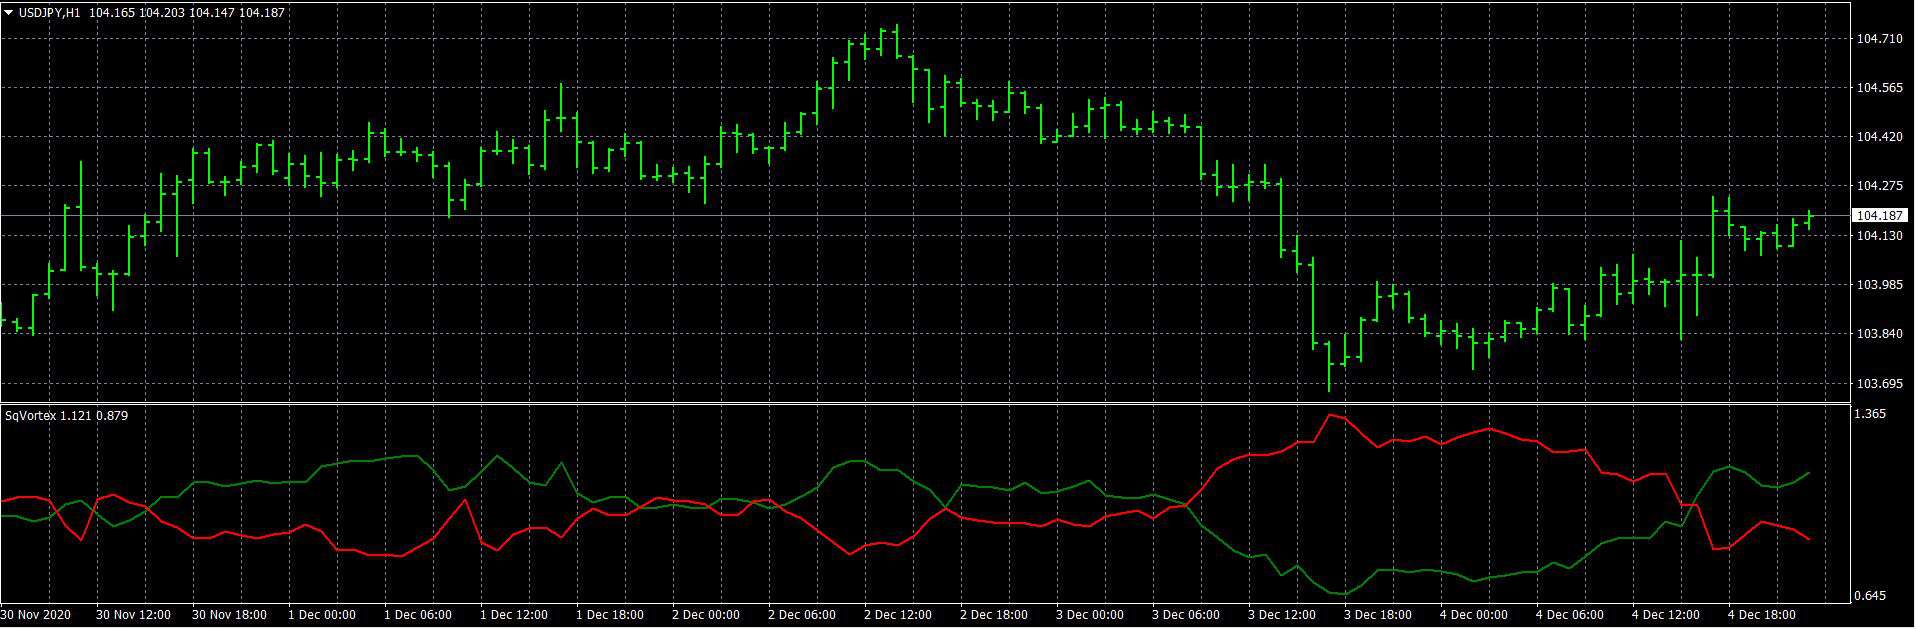
Vortex
The Vortex Indicator is a relatively new indicator developed by Etienne Botes and Douglas Siepman in 2010. It is an oscillator that is used to determine the beginning of a new trend and to confirm an ongoing trend, its direction, and strength. The indicator consists of two lines that represent positive and negative trend movements: the uptrend line (VI+) and the downtrend line (VI-).
The logic behind the indicator is simple – the greater the distance between the low of the current bar and the high of the bar that comes next, the greater the upward movement. Similarly, the greater the distance between a bar’s high and the following bar’s low, the greater the downward movement is.
There are 2 long conditions and 2 short conditions:
- Vortex changes trend UP/Down
- Vortex is in UP/Down Trend
There is another interesting information behind the indicator. Co-author Etienne Botes is a currency fund manager with awarded results in the past years. We will study this approach and we will add more conditions based on this indicator.
Kaufman Efficiency Ratio ( KER )
The Efficiency Ratio (KER) was described by Perry Kaufman in his excellent book Smarter Trading. The Efficiency Ratio (KER) measures the efficiency of a trend by dividing the net price movement over a certain time period by the sum of the absolute values of the individual moves. The value of the ER ranges between 0 and 1. Values close to 1 indicate a strong trend, values close to 0 indicate ranging market.
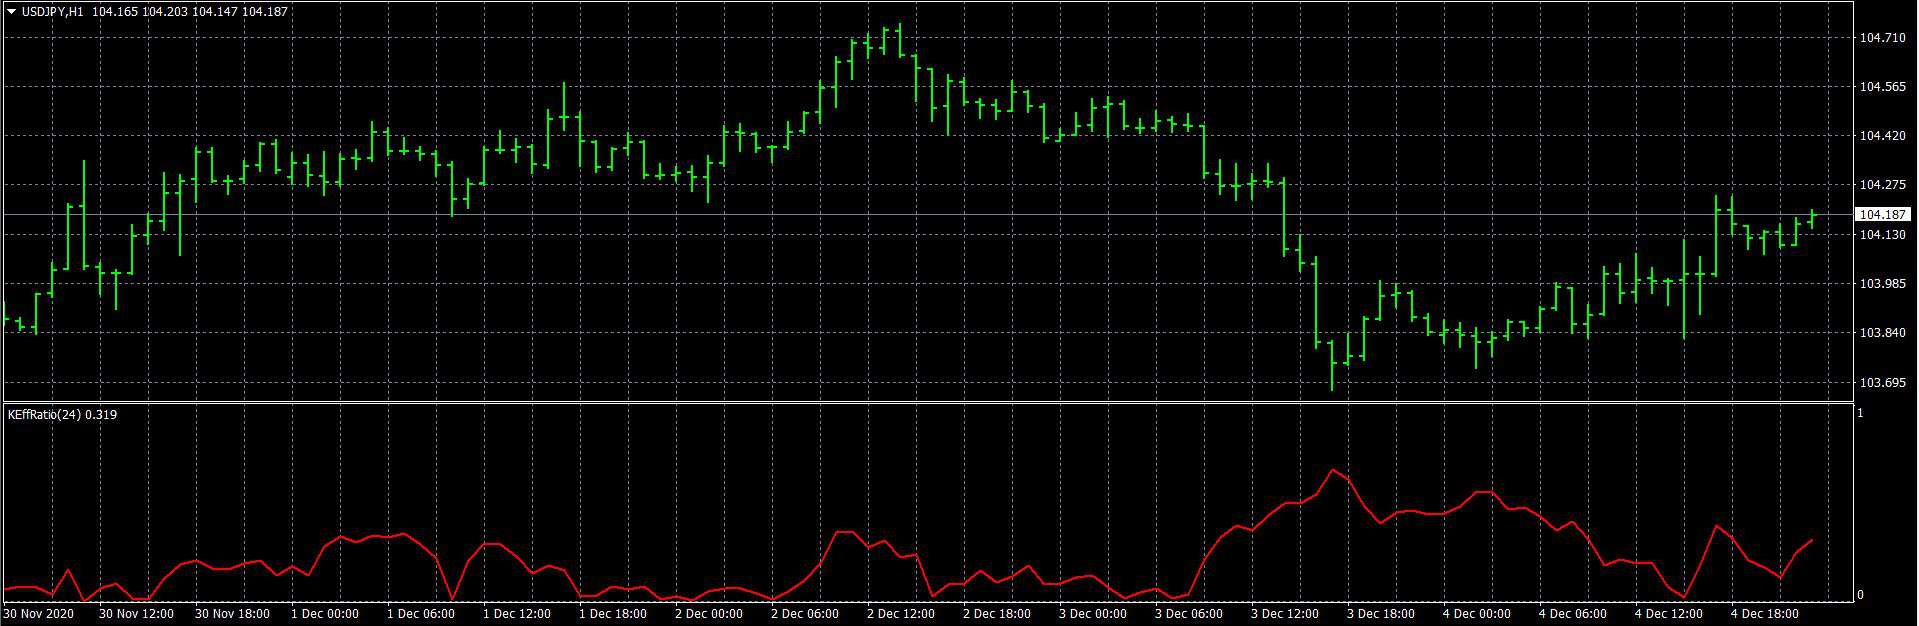
KER is calculated as follows:
KER = Direction / Volatility
Direction = ABS (Close – Close[n])
Volatility = n ∑ (ABS(Close – Close[1]))
n = The efficiency ratio period
KER has one configurable parameter:
Period – Number of bars used for calculation
There are 2 conditions:
- KER ratio is higher than level
- KER ratio is lower than level


Excellent ! Thank you