


 Spanish
 Portuguese
 French
 Italian
 German
(WD) Wasserstein Distance
The Wasserstein Distance indicator is a tool designed to measure how the market’s price distribution changes over time. It works by comparing two sets of historical price data, one from the most recent bars and one from a prior period. The goal is to identify shifts in the underlying price structure, giving you early insight into potential changes in market behavior.
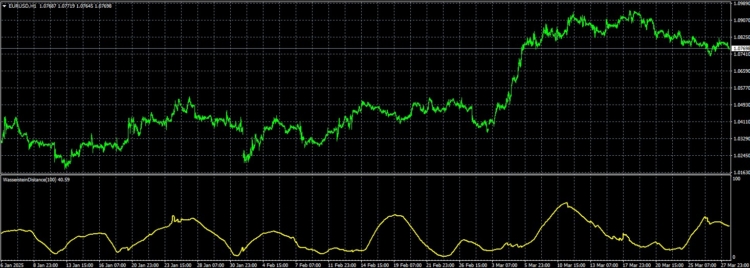
What the indicator measures:
-
Price Distribution Shifts:
The WD indicator looks at the closing prices from two different windows of time. For example, it might compare the last 50 bars to the 50 bars that came before them. By assessing how the distributions of these prices differ, it provides a sense of how stable or volatile the market structure is. -
Wasserstein Distance:
This is the mathematical measure it uses. Essentially, it calculates the “distance” between the two sets of prices in terms of their distribution. The greater the difference, the larger the WD value. This distance is not just a simple average—it’s a more sophisticated comparison that accounts for the shape and spread of the price data.
How the calculation works:
-
Divide into Two Windows:
First, the indicator selects a set number of bars (say 50) from the most recent price data and another set from the preceding period. -
Sort and Compare Prices:
Both sets of prices are sorted in order. The indicator then compares corresponding points in these sorted sets. If the current set of prices has moved far away from the previous set, the Wasserstein distance will be larger. -
Normalize the Output:
The raw distance is then normalized—scaled into a range from 0 to 100. This makes it easy to interpret. A higher value means the price distribution has changed significantly; a lower value means it hasn’t changed much.
How to interpret the WD value:
-
When the WD value is high, it suggests that the current price structure is very different from the previous one. This might mean the market is undergoing a shift, like moving from a trend to a range or vice versa.
-
A low WD value indicates that the price structure hasn’t changed much, so the current market behavior is likely stable.
Parameter considerations:
-
Period:
The “Period” parameter determines how many bars to include in each price window. Shorter periods will react more quickly to changes but may be more erratic. Longer periods smooth out noise and offer more stable signals. -
Shift:
Although not always necessary, a shift can be used to offset the indicator’s calculation, letting you analyze how the market behaved a certain number of bars back.
What it’s good for:
The WD indicator doesn’t tell you when to buy or sell. Instead, it helps you stay aware of how the market’s price structure is evolving. If you see the WD value start to climb, it’s a signal that the market’s rhythm might be changing. That could mean a new trend is forming, or the existing trend is weakening. With this information, you can pay closer attention, adjust your strategies, and make more informed decisions.
Indicator Availability:
This indicator is implemented for MT4, MT5, TradeStation, and MultiCharts.
Using Custom Blocks for Conditions:
You can easily define your own conditions in StrategyQuant X using Custom Blocks. This allows you to set up parameters such as periods or steps to fine-tune the indicator to your strategy. For more detailed information, refer to the following resources:
Importing Custom Indicators into SQX:
To import custom indicators into StrategyQuant X, follow the step-by-step instructions provided here:
Import & Export Custom Indicators and Other Snippets


excellent ! thank you Ivan