Documentation
Applications
Last updated on 4. 8. 2021 by Mark Fric
Example – per strategy custom analysis
Page contents
We will make a per strategy custom analysis as the first example. It is only a simple demonstration, but it shows how to use custom analysis also in conjunction with custom databank columns.
This example will do the following:
- Custom analysis method will go through the results stored after strategy backtests and computes how many crosschecks were used
- A new custom databank column then displays this number in the databank
Step 1 – Create new Custom analysis snippet
Open CodeEditor, click on Create new and choose Custom analysis (CA) option at the very bottom. Name it CAExampleStr.
This will create a new snippet CAExampleStr.java in folder User/Snippets/SQ/CustomAnalysis
This snippet currently looks like this:
package SQ.CustomAnalysis;

import com.strategyquant.lib.*;

import java.util.ArrayList;

import com.strategyquant.datalib.*;
import com.strategyquant.tradinglib.*;

public class CAExampleStr extends CustomAnalysisMethod {

    //------------------------------------------------------------------------
    //------------------------------------------------------------------------
    //------------------------------------------------------------------------

    public CAExampleStr() {
        super("CAExampleStr", TYPE_FILTER_STRATEGY);
    }

    //------------------------------------------------------------------------

    @Override
    public boolean filterStrategy(String project, String task, String databankName, ResultsGroup rg) throws Exception {
        return true;
    }


    //------------------------------------------------------------------------

    @Override
    public ArrayList<ResultsGroup> processDatabank(String project, String task, String databankName, ArrayList<ResultsGroup> databankRG) throws Exception {
        return databankRG;
    }
}
As you can see it has three methods:
CAExampleStr()
a constructor, the only things you should set here is the name of your CA method that will appear in the UI, and the type.
By default, the type is TYPE_FILTER_STRATEGY, which means it is a per strategy method.
Other possible options are:
TYPE_PROCESS_DATABANK – CA that will process the whole databank, we will show it in another example.
TYPE_BOTH – CA that has methods for both per strategy and per databank analysis.
The type of the custom analysis determines if this snippet is shown in per strategy or per databank choice.
filterStrategy()
this is a method that is called for every strategy before it is saved into databank – if the use of custom analysis is configured. It will get a strategy with completed backtests and crosscheck (ResultsGroup object) and it must return true/false.
processDatabank()
is a method that is called to process the whole databank – it will get an array of all strategy results (ResultsGroups) as a parameter, and it returns an array of ResutsGroups back.
Because our method is only per strategy, we don’t need processDatabank() method and we can delete it from the snippet.
Step 2 – Implement the filterStrategy() method
All the “magic” will be done in filterStrategy() method, here we will count the number of crosschecks that were used on the strategy. How to do that?
ResultsGroup is an object that contains the strategy and all the backtest + crosscheck results for the strategy. As the name suggests it is a group of results that are stored under various keys.
To count how many crosschecks were used we must go through all the results and check if the results for a given crosscheck exist. If not, the crosscheck was not used.
To make it more complicated some results (for example Monte Carlo) are stored in a special way, so we must determine their usage differently.
There are 8 different crosschecks in SQ at the time of writing this article:
- What if simulations
- Monte Carlo trades manipulation
- Higher backtest precision
- Backtests on additional markets
- Monte Carlo retest methods
- profile / Sys. Param. Permutation
- Walk-Forward Optimization
- Walk-Forward Matrix
If you would configure Retester to perform all the crosschecks and you would then log all the keys+results that are stored in ResultsGroup you’ll get these keys:
Portfolio
Main: EURUSD_M1/H1
CrossCheck_WhatIf
CrossCheck_HigherPrecision
AdditionalMarket: GBPUSD_M1/H1
AdditionalMarket: USDJPY_M1/H1
WF: 10 runs : 20 % OOS
WF: 5 runs : 10 % OOS
…
WF: 15 runs : 40 % OOS
WF: 20 runs : 40 % OOS
Note that the actual number of keys depends also on the configuration of come cross checks. For example, every additional backtest is stored under its own key, the same is valid for WF runs + OOS combinations.
Because there were some additional markets there is also a special key Portfolio that contains result for the portfolio of main + additional backtests.
Also note that there are no keys for Monte Carlo or Opt. profile / Sys. Param. Permutation results, they are stored in another way which we will explain later.
Step 3 – Counting ”simple” crosschecks
By simple we mean the crosschecks that store their results as different keys in ResultsGroup objects.
Determining if the crosscheck were used is simple in this case, the code for filterStrategy() would look like this:
public boolean filterStrategy(String project, String task, String databankName, ResultsGroup rg) throws Exception {
        List<String> keys = rg.getResultKeys();

        int crosschecksCount = 0;
        boolean additionalMarketUsed = false;
        int wfCount = 0;

        for(int i=0; i<keys.size(); i++) {
            String key = keys.get(i);

            if(key.equals("CrossCheck_WhatIf")) {
                // contains What if simulations
                crosschecksCount++;
            }
            if(key.equals("CrossCheck_HigherPrecision")) {
                // contains Higher backtest precision
                crosschecksCount++;
            }

            if(key.startsWith("AdditionalMarket:")) {
                additionalMarketUsed = true;
            }

            if(key.startsWith("WF:")) {
                wfCount++;
            }
        }

        if(additionalMarketUsed) {
            // contains one or more Backtests on additional markets
            crosschecksCount++;
        }

        if(wfCount == 1) {
            // contains Walk-Forward Optimization
            crosschecksCount++;
        } else if(wfCount > 1) {
            // contains Walk-Forward Matrix
            crosschecksCount++;

            // this is tricky, when WF matrix was run we cannot determine
            // if also single Walk-Forward Optimization was running,
            // so we'll count it as well
            crosschecksCount++;
        }

        // contains Monte Carlo trades manipulation
        // contains Monte Carlo retest methods
        // contains Opt. profile / Sys. Param. Permutation
        // TO BE DONE
        ...
Determining usage of What If and Higher precision crosschecks is easy – only check if the list of keys contains the constant.
Determining usage of Backtests on additional markets is similar, we only must be aware that each additional backtest is stored with its own key.
Determining usage of Walk-Forward Optimization and Matrix is also simple, we will just check the number (if any) of keys with prefix “WF:”
The only tricky thing here is that if Walk-Forward Matrix crosscheck was used then we are unable to recognize if also single Walk-Forward Optimization crosscheck was used, because it uses the same key to store its result.
Our crosschecksCount variable now contains the real number of these crosschecks used, except for Monte Carlo and Opt. profile crosschecks which we will recognize in the next step.
Step 4 – Recognizing usage of “special” crosscheck
As said previously, Monte Carlo and Opt. profile / Sys. Param. Permutation results are stored in a special way.
Instead of saving them under their own key in ResultsGroup, they are stored in special objects in main result.
We can determine if Monte Carlo manipulation crosscheck results was used like this:
// get main result, this is where Monte Carlo simulations are stored
Result mainResult = rg.mainResult();

if(mainResult.getInt("MonteCarloManipulation_NumberOfSimulations") > 0) {
// contains Monte Carlo trades manipulation result
        crosschecksCount++;
}
Main result is the main backtest result, here is where MC results are stored. We simply try to get a number of MC simulations, and if it is bigger than 0 we know it contains some MC manipulation results.
We can check the usage f Monte Carlo retest crosscheck in a similar way:
if(mainResult.getInt("MonteCarloRetest_NumberOfSimulations") > 0) {
    // contains Monte Carlo trades manipulation result
    crosschecksCount++;
}
The last one to check is Opt. profile / Sys. Param. Permutation. It is stored in its own object in ResutsGroup, we will simply check if the object exists there:
if(rg.getOptimizationProfile() != null) {
        // contains Opt. profile / Sys. Param. Permutation result
        crosschecksCount++;
    }
Step 5 – Save the count to strategy results
Now that we have the count of crosschecks used we want to display it in a new databank column (that will be created later)
Right now, we have the number of crosschecks saved in a variable crosschecksCount, but we need to save it as a custom data to ResultsGroup, so that the databank column snippet can retrieve it when it will be displaying its value.
Fortunately, this is quite simple – we can save any object to ResultsGroup special values by calling:
rg.specialValues().set(String key, Object value);
in our case:
rg.specialValues().set("CA_NumberOfCrosschecks", crosschecksCount);
We will retrieve this value in the next step to display it in the databank.
As the last thing we will return true because we will be not using this custom analysis for filtering.
Note – If you want to use custom analysis for filtering you will simply return true or false in this method based on the computations from the strategy backtests and depending on this the strategy is dismissed or saved to databank.
So the complete code of our filterStrategy() method is:
    @Override
public boolean filterStrategy(String project, String task, String databankName, ResultsGroup rg) throws Exception {
    List<String> keys = rg.getResultKeys();

    int crosschecksCount = 0;
    boolean additionalMarketUsed = false;
    int wfCount = 0;

    for(int i=0; i<keys.size(); i++) {
        String key = keys.get(i);

        if(key.equals("CrossCheck_WhatIf")) {
            // contains What if simulations result
            crosschecksCount++;
        }
        if(key.equals("CrossCheck_HigherPrecision")) {
            // contains Higher backtest precision result
            crosschecksCount++;
        }

        if(key.startsWith("AdditionalMarket:")) {
            additionalMarketUsed = true;
        }

        if(key.startsWith("WF:")) {
            wfCount++;
        }
    }

    if(additionalMarketUsed) {
        // contains one or more Backtests on additional markets results
        crosschecksCount++;
    }

    if(wfCount == 1) {
        // contains one Walk-Forward Optimization result
        crosschecksCount++;
    } else if(wfCount > 1) {
        // contains Walk-Forward Matrix results
        crosschecksCount++;

        // this is tricky, when WF matrix was run we cannot determine
        // if also single Walk-Forward Optimization was running,
        // so we'll count it as well
        crosschecksCount++;
    }

    // get main result, this is where Monte Carlo simulations are stored
    Result mainResult = rg.mainResult();

    if(mainResult.getInt("MonteCarloManipulation_NumberOfSimulations") > 0) {
        // contains Monte Carlo trades manipulation result
        crosschecksCount++;
    }

    if(mainResult.getInt("MonteCarloRetest_NumberOfSimulations") > 0) {
        // contains Monte Carlo trades manipulation result
        crosschecksCount++;
    }

    if(rg.getOptimizationProfile() != null) {
        // contains Opt. profile / Sys. Param. Permutation result
        crosschecksCount++;
    }


    rg.specialValues().set("CA_NumberOfCrosschecks", crosschecksCount);

    return true;
}
Step 6 – Add new databank column
We computed the number of crosschecks used in custom analysis snippet and now we want to display it in the databank. To do this we need to create a new databank column.
Again, click on Create new in CodeEditor and this time create a new databank column. Name it NumberOfCC.
The default code for databank column snippet looks like this:
package SQ.Columns.Databanks;

import com.strategyquant.lib.*;
import com.strategyquant.datalib.*;
import com.strategyquant.tradinglib.*;

public class NumberOfCC extends DatabankColumn {

  public NumberOfCC() {
    super("NumberOfCC",
          DatabankColumn.Decimal2, // value display format
          ValueTypes.Maximize, // whether value should be maximized / minimized / approximated to a value
          0, // target value if approximation was chosen
          0, // average minimum of this value
          100); // average maximum of this value

    setWidth(80); // defaultcolumn width in pixels

    setTooltip("Your tooltip here");

    /* If this new column is dependent on some other columns that have to vbe computed first, put them here.
       Make sure you don't creat circular dependency, such as A depends on B and B depends on A.
       Columns (=stats values) are identified by the name of class)
    */
    //setDependencies("DrawdownPct", "NumberOfTrades");
  }

  //------------------------------------------------------------------------

  /**
   * This method should return computed value of this new column. You should typically compute it from the list of orders
   * or from some already computed statistical values (other databank columns).
   */
  @Override
  public double compute(SQStats stats, StatsTypeCombination combination, OrdersList ordersList, SettingsMap settings, SQStats statsLong, SQStats statsShort) throws Exception {

    /* an example - this is how you can get other values that this new value is dependent on */
    //int numberOfTrades = stats.getInt("NumberOfTrades");
    //double drawdownPct = stats.getDouble("DrawdownPct");

    /* an example - calculating net profit from the list of trades */
    double netProfit = 0;

    for(int i = 0; i<ordersList.size(); i++) {
      Order order = ordersList.get(i);

      if(order.isBalanceOrder()) {
        // don't count balance orders (deposits, withdrawals) in
        continue;
      }

      /* method getPLByStatsType automatically returns PL depending on given stats type - in money, % or pips */
      double PL = getPLByStatsType(order, combination);

      netProfit += PL;
    }

    /* round and return the value. It will be saved into stats under the key "NumberOfCC" */
    return round2(netProfit);
  }
}
It has a compute() method that can go through stats and orders to compute the particular metric.
In our case we don’t need this, we will not use anything from orders, instead we will retrieve value for CA_NumberOfCrosschecks that we computed in custom analysis.
So we can delete the whole compute() method and use a special method getValue() instead. This one is not generated by default, it is used to retrieve special values, for example symbol and timeframe.
getValue() gets the ResultsGroup as a parameter and returns a String that is displayed in databank for this column.
Our simplified databank column looks like this:
package SQ.Columns.Databanks;

import com.strategyquant.lib.*;
import com.strategyquant.datalib.*;
import com.strategyquant.tradinglib.*;

public class NumberOfCC extends DatabankColumn {

  public NumberOfCC() {
    super("NumberOfCC", DatabankColumn.Decimal2, ValueTypes.Maximize, 0, 0, 100);
  }

  //------------------------------------------------------------------------

  @Override
  public String getValue(ResultsGroup rg, String resultKey, byte direction, byte plType, byte sampleType) throws Exception {
    int value = rg.specialValues().getInt("CA_NumberOfCrosschecks", -1);

    if(value == -1) {
      // this means value was not set
      return NOT_AVAILABLE;
    } else {
      // return value converted to String
      return java.lang.Integer.toString(value);
    }
  }
}
Note that we used a call:
rg.specialValues().getInt("CA_NumberOfCrosschecks", -1);
to get the value previously stored by custom analysis as int (number).
The -1 value is the default one, it will be used if no value for key CA_NumberOfCrosschecks will be found. This will happen if we do not configure UI to run our custom analysis method.
In this case we will return N/A string.
Special note about filtering according to this column
Because this databank column is a special one, and its value is computed by custom analysis it CANNOT be used in custom filters in Ranking. This will not work because these filters are evaluated before the custom analysis is started, and this column will have no value then.
To filter using values computed by custom analysis please use the true/false return of the filterStrategy() method in custom analysis snippet.
Step 7 – Making it all work
After successful compilation of our new snippets in CodeEditor and restart of StrategyQuant we can now try to use it. We can do it in Retester to see how it works.
First create a new databank view, let’sname it CA View and add some columns + our new column NumberOfCC there.
When we’ll switch to this view we’ll see that our new column is N/A:
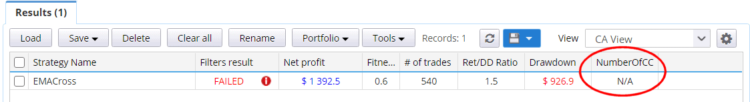
It is because the value that it is displaying is not computed yet.
So let’s use the new custom analysis snippet in the Retester – we only must configure it in Ranking tab as follows:
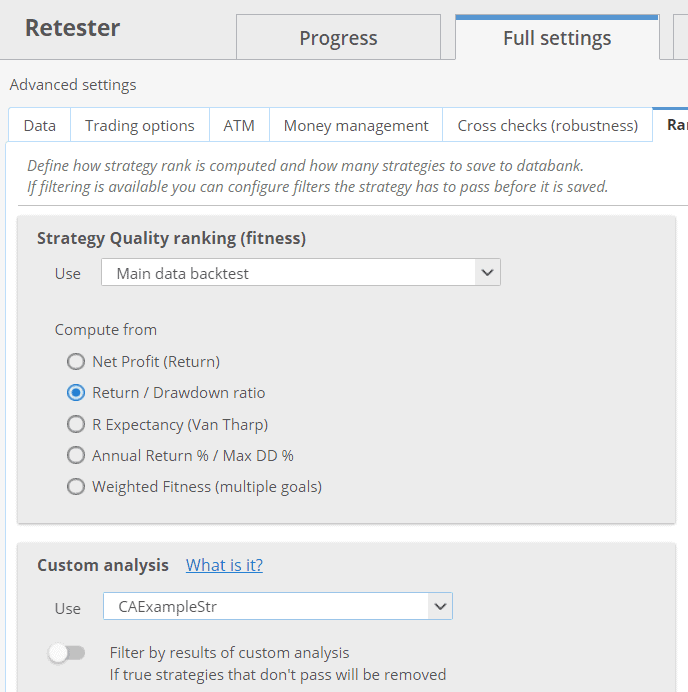
Our example custom analysis snippet will be now applied to every strategy that is retested in Retester before it is saved into a databank.
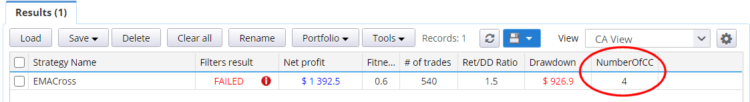
So, let us try to turn on some cross checks in Retester and run it.
Depending on how many crosschecks you actually selected you should now see some number in the new column:
Conclusion
This was a simple demonstration of new custom analysis functionality applied per strategy. As you can see:
- it can be used to compute new metrics that cross the boundaries of a single backtest or crosscheck
- it can be used to implement new metrics that are shown in databank
- it can be used for filtering (by returning false)
Was this article helpful? The article was useful The article was not useful
Please release the complete code for step 5(best like step 6 Example)
In my Code Editor,It reports an error
“cannot find symbol symbol:class List location:class SQ.CustomAnalysis.CAExampleStr”
List<String> keys = rg.getResultKeys();
Sorry I’m new to this and couldn’t find the error
Me too , I am getting the same error .
I think we need to add : import java.util.*;
at the top of the code
It should works
Thank you!
Excellent !