
Release of SQX 139 Dev 1 and what’s planned for year 2024
We’d like to announce the release of the new SX 139 Dev 1 version – note that this is a development version for testing, not the final 139 version. Most …
Přejít k obsahu | Přejít k hlavnímu menu | Přejít k vyhledávání
trading
First, let’s explain how SR Percent Rank works. The indicator makes a loop over x bars into the past and calculates the percentage of times the current closing price has been between the high and the closing price in the x bars before that.
Thanks to this, we can determine the percent rank of current close price occurrences in the range of past prices and assume that we are in the support, resistance, or breakout zone.
The indicator has two modes:
There are four predefined conditions
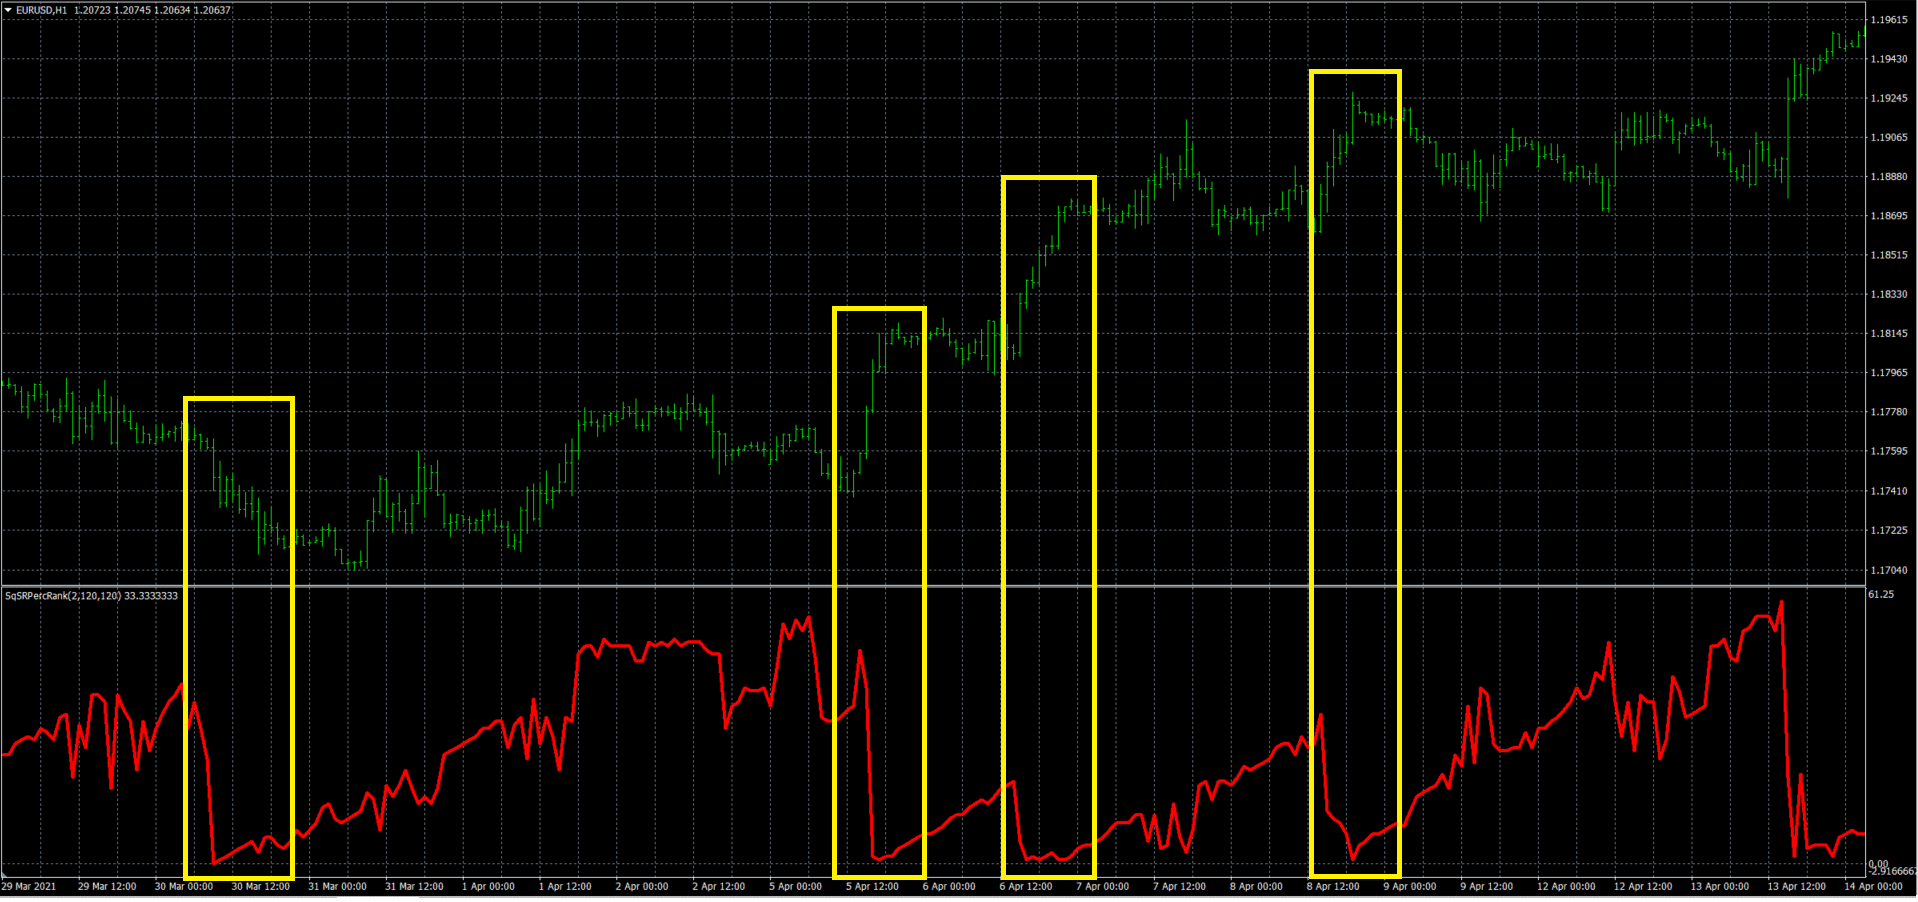
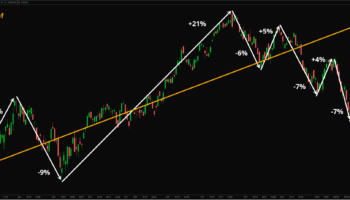
In the above image, you can see the SR Percent Rank on the EURUSD chart with the indicator setting Mode = 2, LookBack Period = 120 bars, and ATR with a period of 120.
If the SR Percent Rank falls to values close to zero, this means that the current closing price has not moved in this range in the past and we are therefore in a breakout situation.
These situations are defined by the condition SR Percent Rank is below level, which is part of the default building blocks in StrategyQuantX.
From the above figure, we can also see that SR Percent Rank is a not – symmetric indicator. This means that in order to determine in which direction the breakout occurs, another indicator is required.
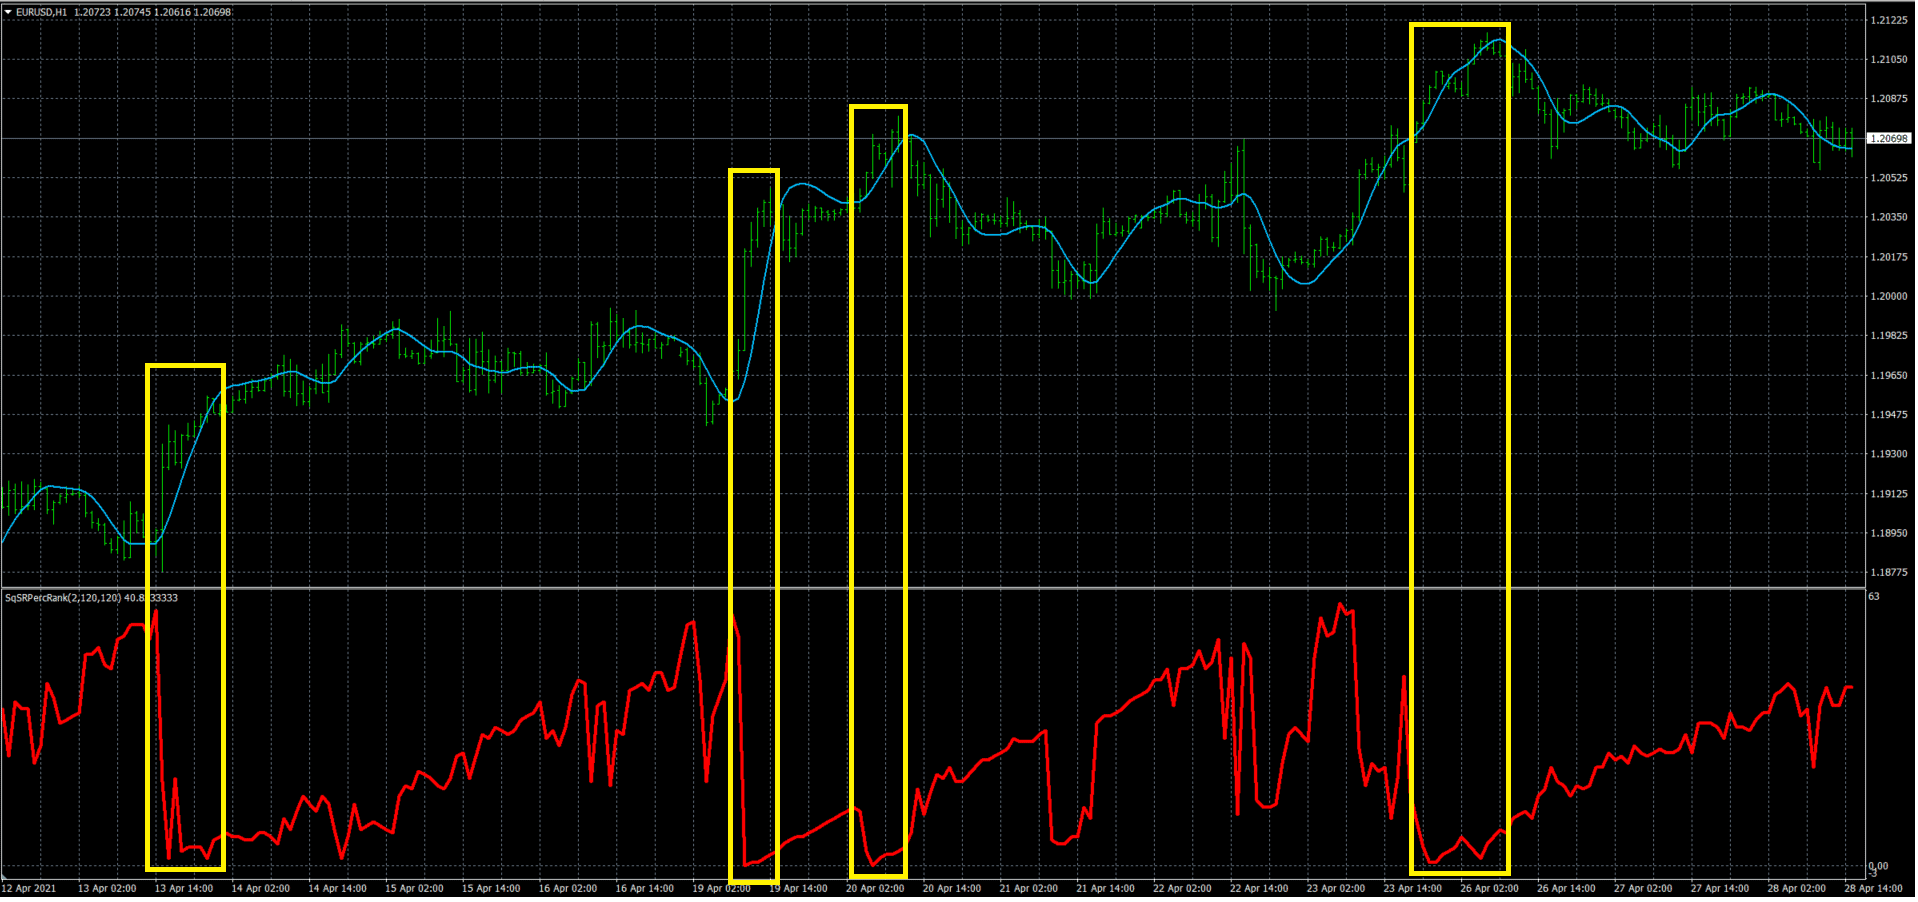
Good candidates may be:
In the chart below you can see the combination of SR Percent Rank and Hull Moving Average.
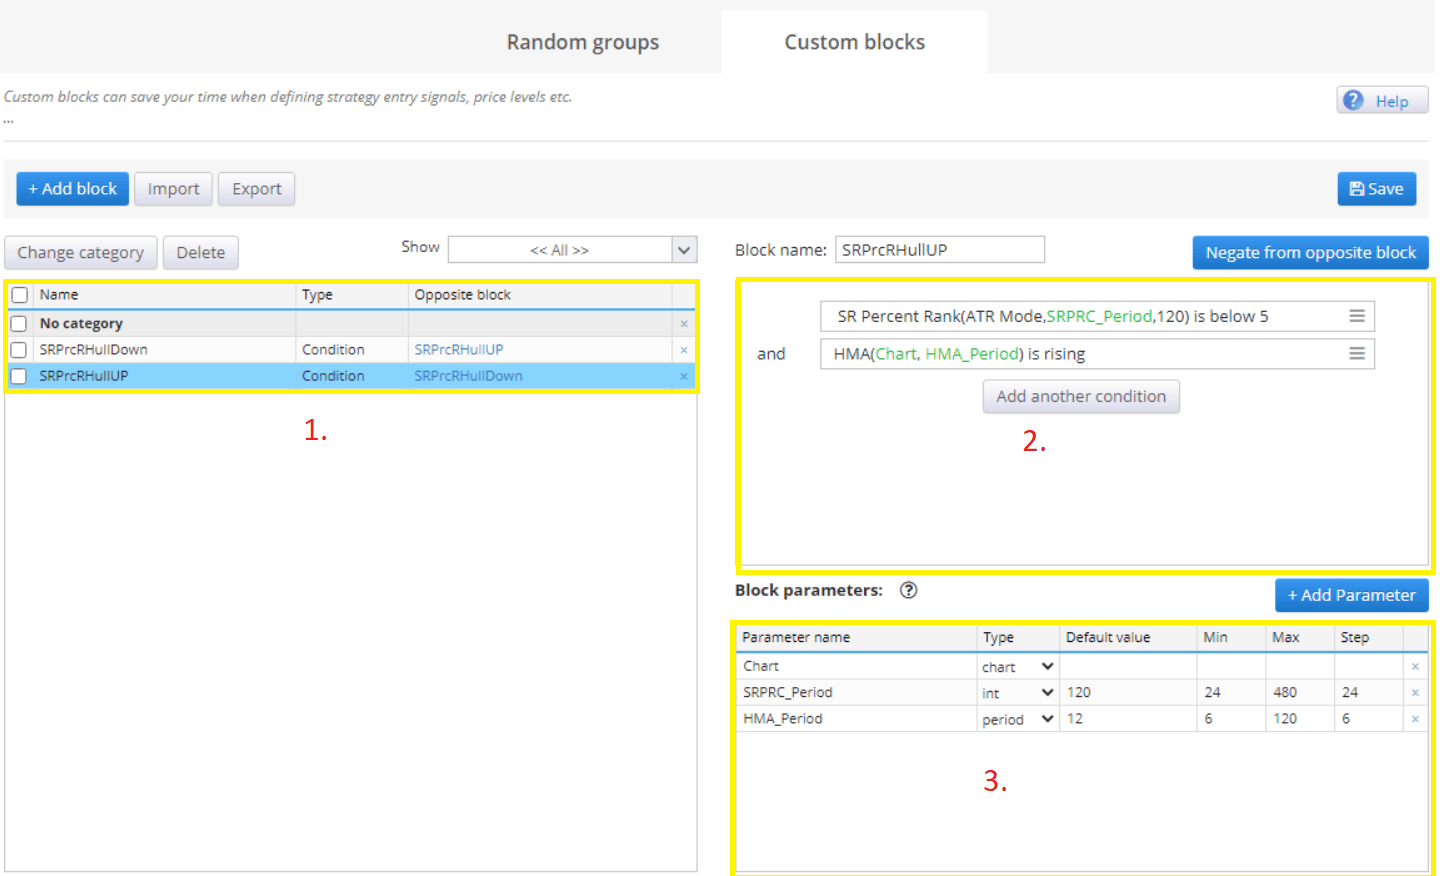
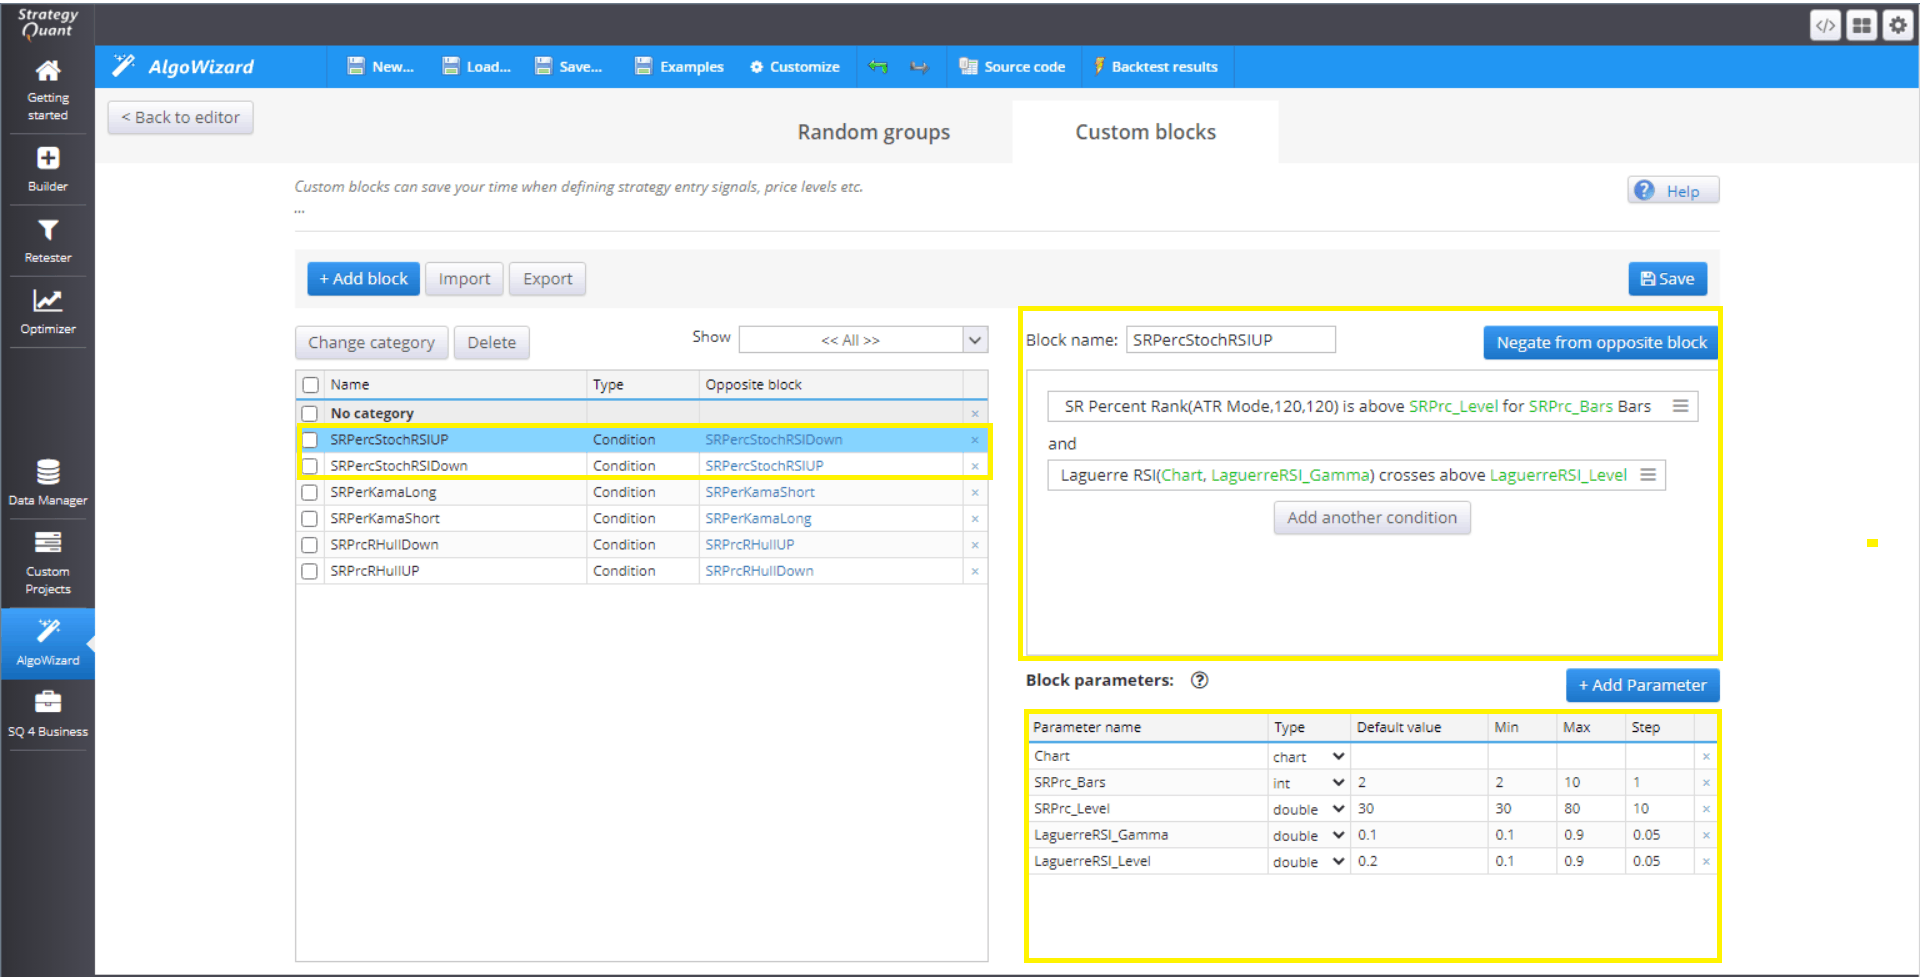
In StrategyQuantX / Algo Wizard in custom blocks, this block will look like this:
If the SR Percent Rank moves a higher value or rises over a longer period of time, it means that the price is in the range of past prices.
From this assumption, we can draw two conclusions

In the above chart, we can see that when SR Percent Rank was at higher levels for a longer time, the price tended to fluctuate. Then a breakout occurred, the SR Percent Rank dropped to levels close to zero. This situation is repeated two times in the above figure.
This situation is captured by the predefined condition block SR Percent Rank is above the level for X bars.
Trading Mean Reversion is not easy, generally, oscillators help in such situations:
In the following chart, we can see how the combination of SR Percent Rank is above the level for X bars, and Laguerre RSI might look on the chart.
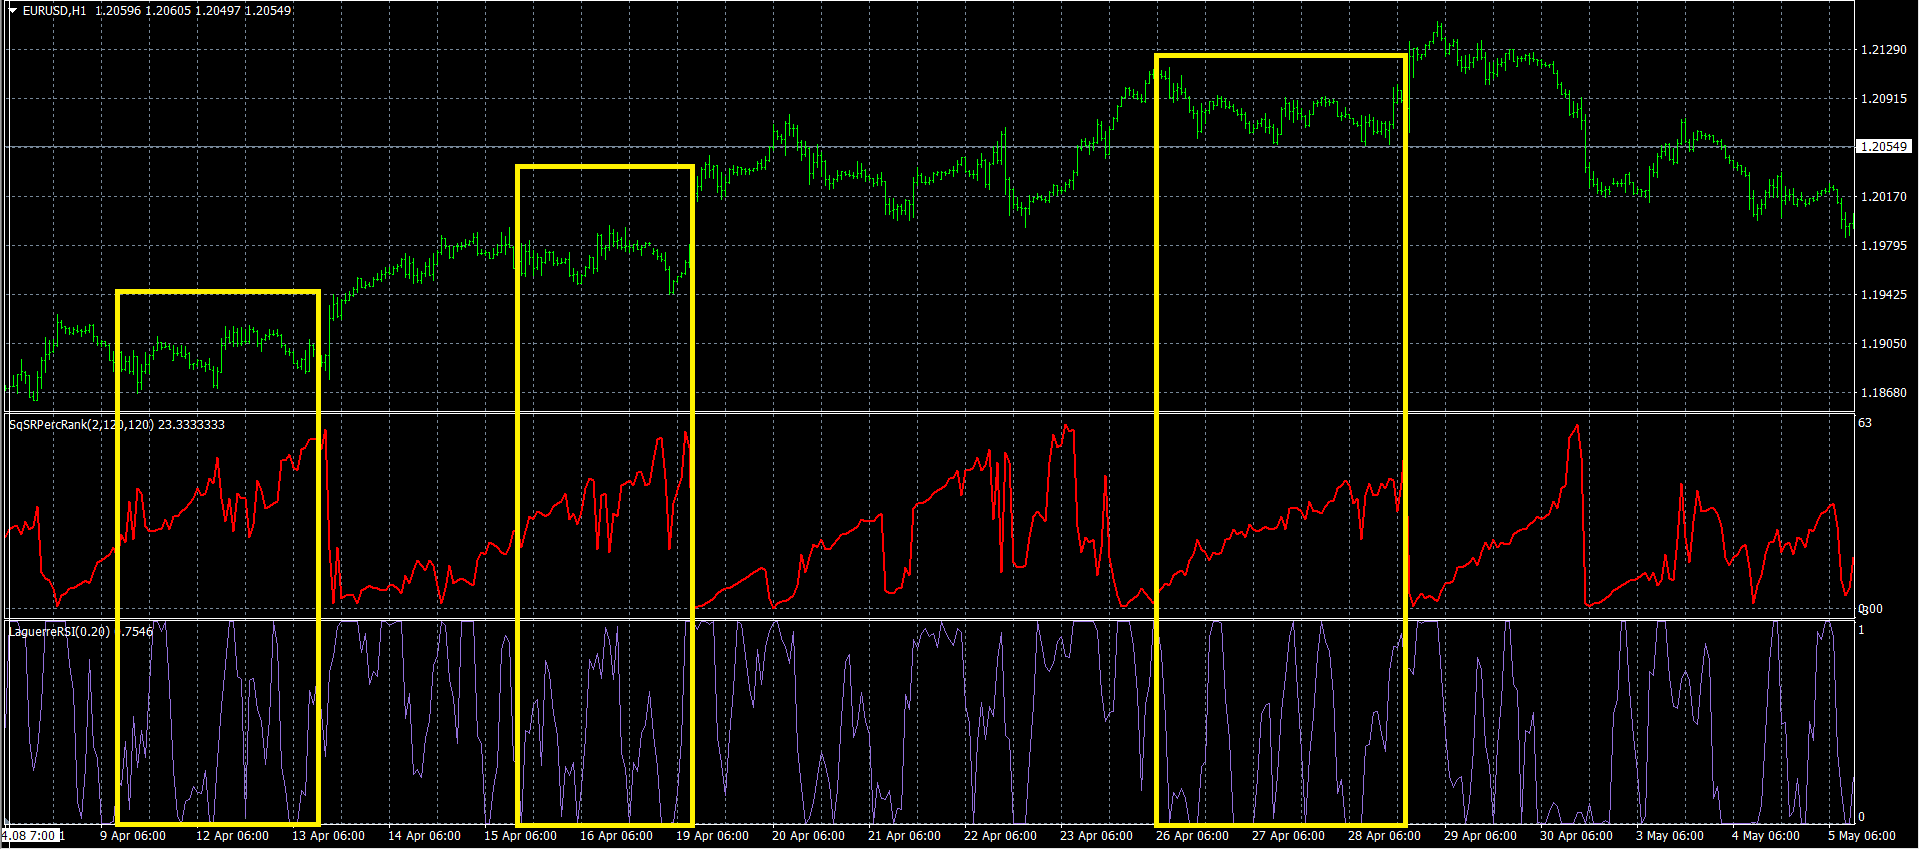
Combine the Custom block in StrategyQuantX AlgoWizard as follows:
Custom blocks allow you to create the basic building blocks of your future strategy, which you can build directly in Algowizard or StrategyQuantX Builder. We believe that the more targeted and specific the blocks you use, the lower the risk of overfitting.
We’d like to announce the release of the new SX 139 Dev 1 version – note that this is a development version for testing, not the final 139 version. Most …

Dive into Algorithmic Trading Without the Coding Headache! Are you intrigued by algorithmic trading but dread the thought of coding? Today marks the beginning of our exciting series that’s about …
 Tomas Vanek
5. 3. 2024
In this interview, we catch up with Naoufel, a seasoned trader, to explore his journey through the stormy market of 2023. Naoufel is successful trader with verfied track record who …
 Ellie Souckova
12. 12. 2023
current closing price has been between the high and the closing price in the x bars before that.
->current closing price has been between the high and the low price in the x bars before that.
It’s like inside bar occurrences. The higher value means convergence, and lower value means strong trend.