
Release of SQX 139 Dev 1 and what’s planned for year 2024
We’d like to announce the release of the new SX 139 Dev 1 version – note that this is a development version for testing, not the final 139 version. Most …
Přejít k obsahu | Přejít k hlavnímu menu | Přejít k vyhledávání
In today’s episode, we build on the findings from the previous parts, in which we tried to identify and measure the factors that can affect the true out-of-sample performance of strategies. ( WFOS )
This entire series is the result of research conducted in 2019/2020 that focused thematically on the methodology used to evaluate and select strategies generated in StrategyQuant
The first part was dedicated to the impact of strategy complexity and number of trades on potential performance in the true-out-of-sample range, and the second part to the sensitivity of the strategy to higher spreads.
The third part dealt with the influence of traditional ranking indicators on the performance of strategies in the true-out-of-sample ( WFOS ).
In today’s part, we will apply simple feature selection techniques and try to evaluate the factors that influence the performance in True out of sample period ( WFOS ). The methods used for this analysis can be found at https://machinelearningmastery.com/ or in the excellent book Data Preparation for Machine Learning.
What do I mean by features? Let us imagine we are generating strategies. Let us define the in-sample data period and the out-of-sample data period. The out-of-sample period is the one we do not use for ranking or strategy selection in strategy generation.
By features, we mean the qualitative metrics of the strategies in their out-of-sample period. Selecting strategies from in-sample data is not very useful when used genetically because of overfitting. And their effects are studied on a sample of data that we did not use at all in their development.
The goal is to identify such factors in an out-of-sample period that might have hypothetical predictive value for the profit factor strategy in the true-out-of-sample period. (WFOS )
Using the simple method, we will measure the correlation between the indicators in the out-of-sample period and the profit factor in the true out-of-sample period. (WFOS )
There are several options when choosing a correlation coefficient. Each has its own advantages and disadvantages. In our case, the deciding factor will be how robust it is to outliers. You can find many sources and opinions on the Internet, our choice falls on Spearman’s correlation coefficient. You can find more on this topic on Stackexchange in this forum
In the following analysis, we will analyze the strategy according to the selection and the findings we have made in the previous parts.
We will simulate 4 scenarios:
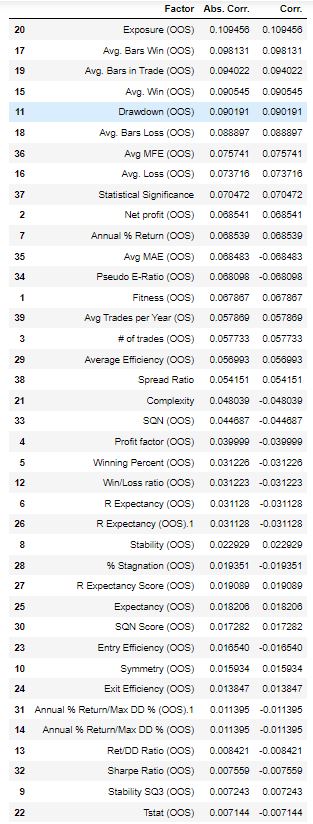
In this example, we do not use selection. In other words, we take the raw data set and analyze the correlation between the out-of-sample strategy metrics and the profit factor in the true out-of-sample period ( WFOS ).
In the columns above we have listed:
The higher the absolute Spearman correlation coefficient is, the stronger is the relationship between the factor and the profit factor in True out of sample period.
It is worth paying attention to the strategy metrics that come first – Exposure In other words, the longer the strategies have been on the market, the higher the profit factor in true out of sample is likely to be.
Another factor that deserves attention and comes first is statistical significance, which is the relationship between the number of trades in a strategy and its complexity. In other words, the more trades a strategy makes and the less completeness it has, the higher the statistical significance.
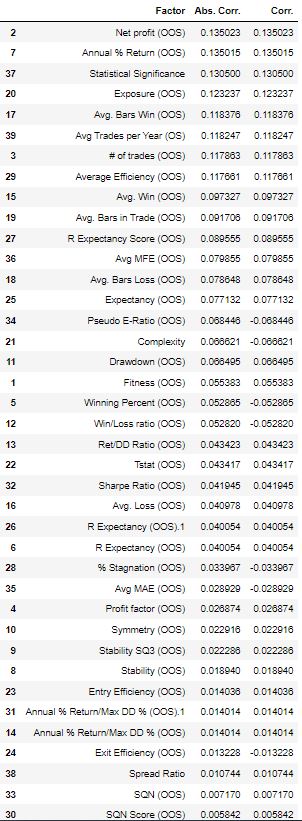
In this dataset, I will only consider strategies with complexity 3 to 6. I consider complexity as a key factor. A good quote that captures the essence of this idea is
“If the algorithm is too complex or flexible (e.g. it has too many input features or it’s not properly regularized), it can end up “memorizing the noise” instead of finding the signal.”

We work in conditions of possible high overfitting. One of the basic approaches to counter this problem is to increase the number of observations, i.e. the number of trades, in addition to lower complexity. Again, the reasoning about the number of trades is based on the literature on machine learning but also on the excellent series by Martin Tinsley which can be found on youtube under the title Algorithmic Backtesting & Optimization for Alphas.

In the table above we see % Annual Return, Exposure, and Avg.Win in the top places.
In other words: If I were to select strategies for the period 1986-2022 and use Out of Sample 2006-2022, I would start with strategies based on these metrics.
Summary
If we look carefully at the different scenarios, we can see that some factors are repeated.
In other words filtering strategies by their exposure, Avg. Win, and annual net profit can be a good start when choosing a strategy evaluating.
Let’s also note that some traditional factors like Sharpe Ratio, RetDD ratio ranked constant lower in our analysis. This analysis can be done for any market and any timeframe.
Using StrategyQuantX it is possible to collect data and in an external environment to evaluate it. I used python but you can use excel or anything else.
It’s a very simplified version of what I actually use, but it’s a good start for your own research. With StrategyQuantX it is possible to collect a huge amount of data using custom projects exporting data from a database and it is up to you how you use this tool.

We’d like to announce the release of the new SX 139 Dev 1 version – note that this is a development version for testing, not the final 139 version. Most …

Dive into Algorithmic Trading Without the Coding Headache! Are you intrigued by algorithmic trading but dread the thought of coding? Today marks the beginning of our exciting series that’s about …
 Tomas Vanek
5. 3. 2024
In this interview, we catch up with Naoufel, a seasoned trader, to explore his journey through the stormy market of 2023. Naoufel is successful trader with verfied track record who …
 Ellie Souckova
12. 12. 2023
thanks for article
Yes thank you very much for this article !!!!