Part 3:Profit Factor, Ret/DD Ratio/ Stability SQ3/ Annual % Return,Winning Percent, Win/LossRatio/ Sharpe Ratio
Before reading this part, I recommend that you read the two parts that cover Part 1 and Part 2
In today’s episode, we will analyze the commonly used strategy metrics that many algo developers use when evaluating strategies.
As always, let us get back to how we plotted 1.2 million strategies.
So we have generated about 1.2 million strategies using only basic filters like a minimum number of trades and Stability SQ3 > 0.6. We used the largest possible data sample for the period 1987-2017 IS + OS and for the period 2017-2020. (WFOS) As True Out-of-sample (WFOS ) we used the period 2019-2020 – two years. During this period we observed the effects of selection, robustness tests, and other analyses. We have developed strategies for a 1-hour time frame and a 4-hour time frame, we used the Darwinex fee structure and had 1 pip slippage in each market. We modify the dataset by limiting the average number of trades per year to 100. Too high number of trades is unacceptable from the point of view of cost reduction and slippage, in trading reality.
I tried to adjust each strategy performance metrics for outliers. That did not always work, and it was not always perfect. Most of the time, I adjusted the strategy performance metrics to show 0.5 to 99.5 percentile values. Then I did a quantile normalisation of the data by splitting it into 10 deciles using qcut.
We will analyze these strategy Out of Sample metrics
- Profit Factor
- Ret/DD Ratio
- Stability SQ3
- Annual % Return
- Winning Percent
- Win/Loss Ratio
- Sharpe Ratio
More information on the strategy metrics can be found on this page:
https://strategyquant.com/doc/strategyquant/results-overview/strategy-analysis-metrics/
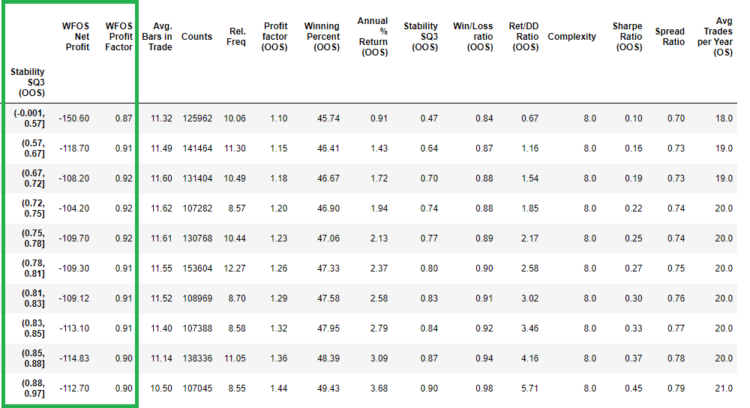
Profit factor ( OOS )
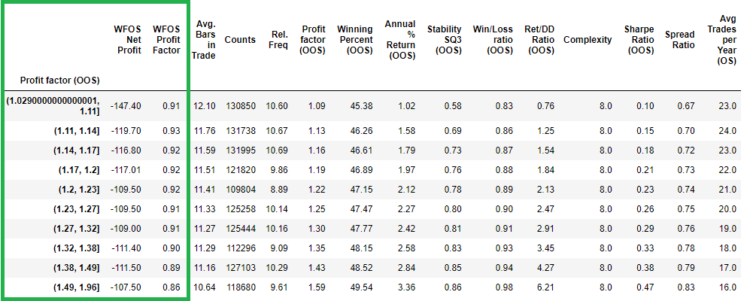
As we can see in the table, higher values of the Profit factor ( OOS ) do not lead to higher values of the WFOS Net profit and the WFOS Profit factor.
Winning Percent (OOS)
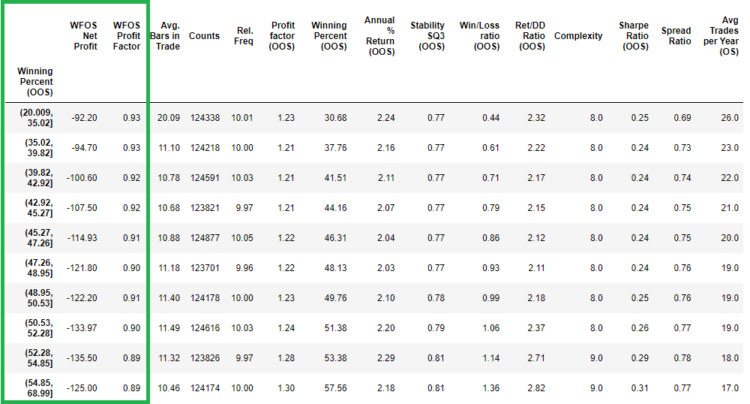
In Winning Percentage (OOS) we see better values for WFOS Net profit and WFOS Profit factor. We get better values in WFOS Period at lower Winning Percent (OOS) values.
Annual % Return ( OOS)
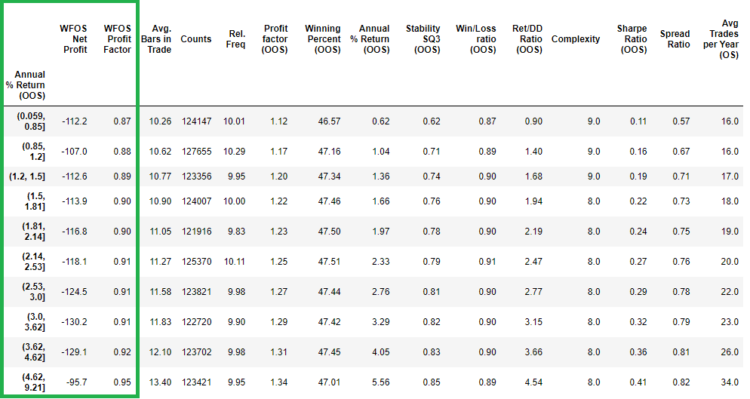
We also see no significant differences in Annual % Return (OOS) between the same periods. In this case, we see the weakness of quantile normalization when the last decile represents strategies with a value of 4.62 -9.21%. Interval si simply too big. Therefore, I tried to divide the annual percentage return metric into simple intervals. You can see the result in the table below:
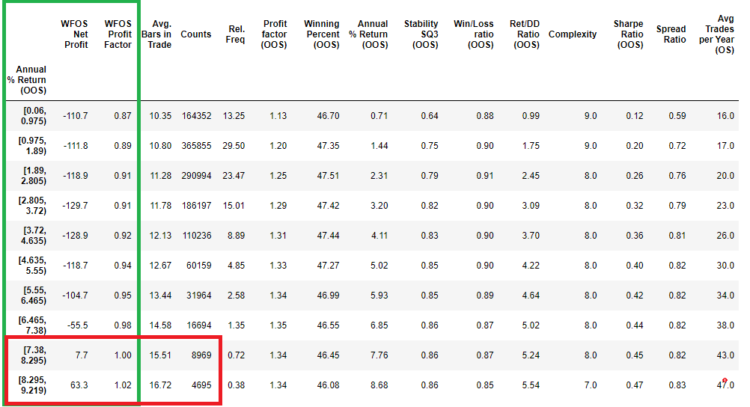
In this case, we see that higher values of the Annual % Return (OOS) can lead to higher values of the WFOS Net profit and the WFOS Profit factor, but with less statistical significance, apart from the fact that there are significantly less strategies in the last two intervals.
Stability SQ3 (OOS)
For stability Stability Q3 (OOS) , we also see no significant differences between the same intervals. In this case, I tried to split the Stability Q3 (OOS) into simple intervals. You can see the result in the table below:
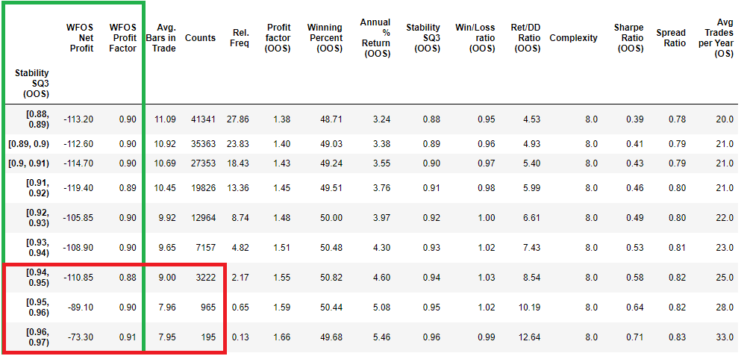
In this case, we see that higher values of Stability SQ3 (OOS) can lead to higher values of WFOS Net profit and WFOS Profit factor, but with lower statistical significance, apart from the fact that there are significantly less strategies in the last two intervals.
Win/Loss Ratio (OOS)
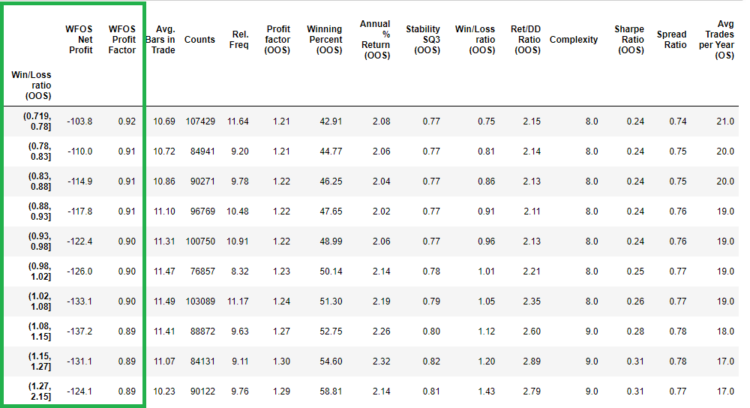
As we can see in the table above, higher values for the Win/Loss ratio (OOS) do not lead to higher values for the WFOS Net profit and the WFOS Profit factor. Rather, the results show that better WFOS values are obtained by lower values for the Win/Loss ratio (OOS).
Return/DD Ratio (OOS)
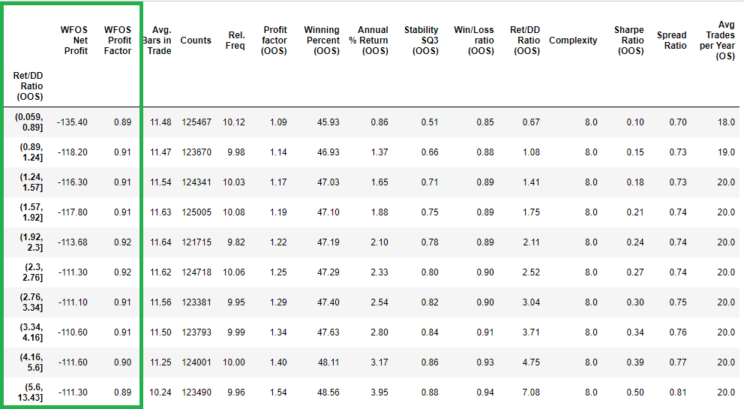
As we can see in the above table, higher values of Return/DD ratio (OOS) do not lead to higher values of WFOS Net profit and WFOS Profit factor. The last decile was 5.5-13.43, so I opted for a simpler form of interpolation than in the previous cases. (I took the interval of all the values and divided them by ten).
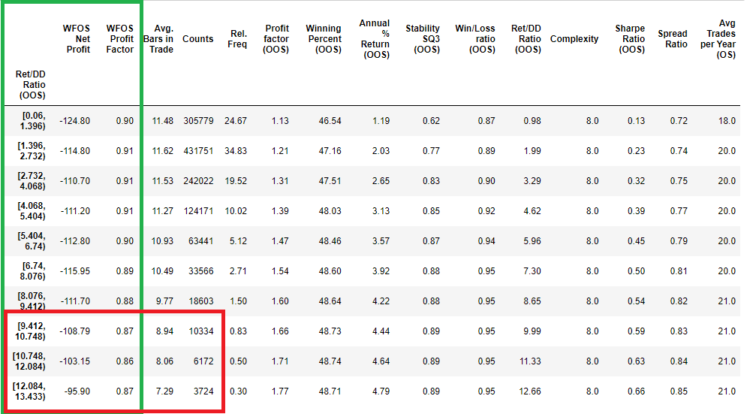
In this case, I do not see us getting significantly better results at high intervals in WFOS.
Sharpe Ratio (OOS)
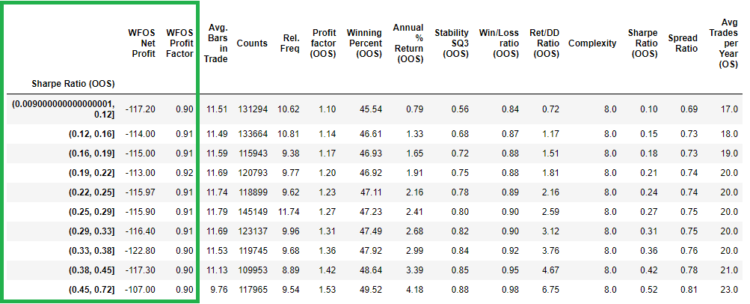
As we can see in the table above, higher Sharpe Ratio (OOS) values do not lead to higher WFOS Net profit and WFOS Profit factor values.
Conclusion
The purpose of today’s article was to point out that many of the metrics I use in rankings or as fitness metrics in genetic starvation have relatively little predictive power. It’s a good idea to do more research before creating a strategy to find out which factors have predictive value.
In the next two episodes, we will look at the same metrics, but with the insights we gained in parts one and two.


 Tomas Vanek

Thank you for excellent study !!!!!! This is impressive !!!!!
Hi, very good work.
This means, the most matrics are not able to filter profitable strategies in the analysis.
In my opinion the curvefitting is too high. If the generated pool of strategies have more curvefitted than non curvefitted strategies => the filter are not working good.
I think: If we use a small building-block- set which produces less curvefitted strategies the filtering with metrics will be better.
Hi Tnicker. Yes, I agree with you and that is also why I advocate simple strategies with low complexity. As for the number of building blocks , I will experiment and compare and share. Check pls this post also: https://strategyquant.com/blog/what-we-have-learned-from-analyzing-1-2-million-fx-strategies/
I am looking forward to the research on the setting of building blocks. Sometimes I am hesitant about what range of building blocks should I choose.
With so many strategies id be interested in knowing…….if you backtest them all on all 28 currency pairs(insample)…..then select strategies that as a portfolio produce a return to dd ratio of say 1 or 1.5…… then see if that produces more predictive powers on the OOS. thanks
Hey we did test but we have found that on long data 1986-2017 MM testing has no effect, However i will prepare in 2022 much better analysis where i will study this again.
These 3 blogs is excellent, thanks very much.
But the pictures is very unclear, could you please reload these pictures?
Dear @clonex (Ivan), As a SQ enthusiast (got the full version recently) I’ve got an idea on how to extract MORE insights from this data that you’re analyzing in the article. There’s a software called Rapid Miner Studio (I’m not their affiliate, but I can re-subscribe with a new account for demo and test it on one of my machines), and it can make sense of any multivariable data applying various stat algorithms. For instance I’ve fed it with a matrix of various metrics (of data going back with various history lengths) for S&P to predict specific pre-calculated future slopes… Read more »