We have added several new indicators and snippets to the sharing server in recent months. In today’s blog post, we’ll briefly go through each of them.
Z – Score
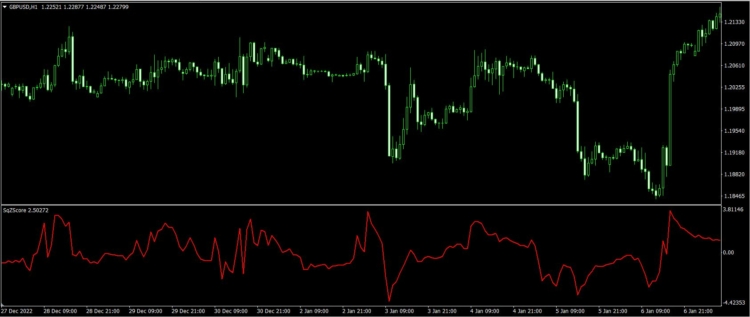
The Z-score measures the currently analyzed value of selected data series relative to its mean, i.e., how many standard deviations away it is from it. The Z-score can be easily interpreted in this way:
If the Z-Score is 0, it means that the value of the data point is equal to the mean. If the Z-Score is 1.0, it means that the value is one standard deviation above the mean. If the Z-Score is -1.0, it means that the value is one standard deviation below the mean.
The indicator has one line:
- Z Score
Z Score has two configurable parameters:
- Applied Price – Type of Price used for indicator calculation
- Period – refers to the number of periods on which the modified moving average line is based.
Indicator is implemented for: MT4/MT5/Tradestation/ Multicharts.
You can download the indicator and conditions here.
Kaufman Moving Average OHLC ( KAMA OHLC)
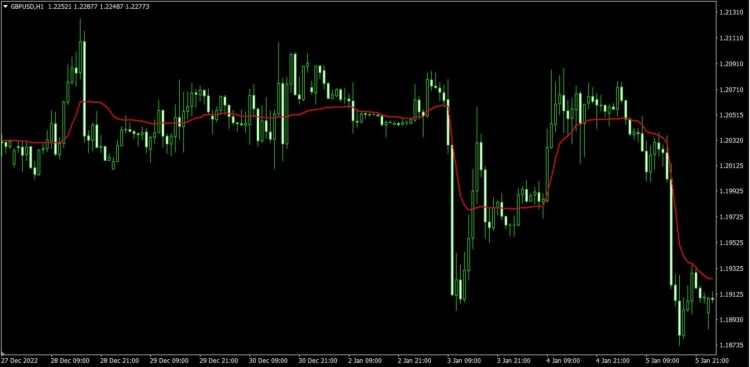
This modification of the KAMA indicator allows you to select the type of prices from which the indicator is calculated. Kaufman Moving Average ( KAMA ) is a type of moving average which accounts not only for price trend but also for market volatility. It closely follows price when noise is low and smooths out the noise when the price fluctuates. Like all moving averages, the KAMA can be used to visualize the trend. If price crosses KAMA it indicates a directional change. Price can also bounce off the KAMA, which can act as dynamic support and resistance.
KAMA OHLC calculation is a bit complicated and but you can find more information Here
KAMA OHLC has four configurable parameters:
- Applied Price – Type of Price used for indicator calculation
- ER period – Number of bars used for calculation of Efficiency Ratio
- Short Period – Number of bars used for calculation of fast EMA (FC)
- Long period – Number of bars used for calculation of slow EMA (SC)
Indicator is implemented for: MT4/MT5/Tradestation/ Multicharts
You can download the indicator here.
Slope Direction Line – SDL
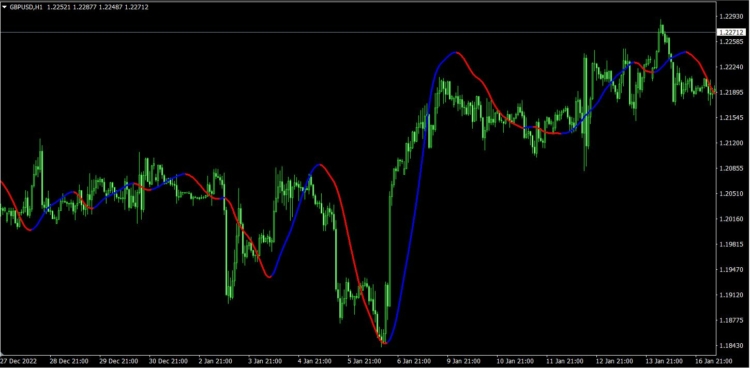
The Slope Direction Line indicator is a technical analysis tool that helps traders identify the direction and strength of a trend in a financial market. It is a simple indicator that plots a line on a chart based on the slope of a weighted moving average. The slope of the line can be used to determine whether a market is trending up, down, or sideways, and the strength of the trend can be determined by the angle of the line. The Slope Direction Line indicator can be used in conjunction with other technical indicators, such as oscillators and volume, to confirm trend direction and strength and make more informed trading decisions.
The indicator has four parameters:
- Period – refers to the number of periods on which the modified moving average line is based.
- MA method – refers to the type of modified moving average line used.
- Computed From – refers to the source of the price data on each bar
The indicator has one line:
- SDL
You can download the indicator here.
Donchian Channels – DCH
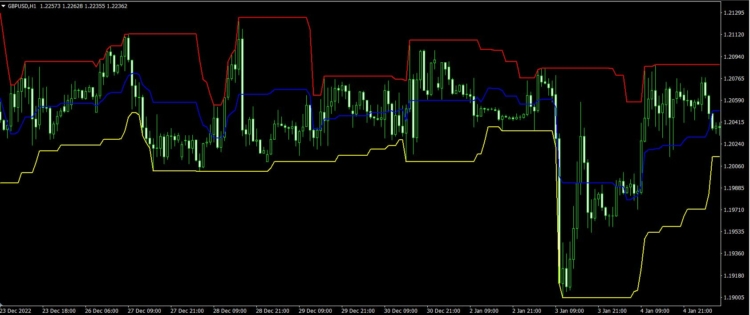
The Donchian channel is an indicator used in market trading developed by Richard Donchian. It is formed by taking the highest high and the lowest low of the last n periods. The area between the high and the low is the channel for the period chosen.
The Donchian channel is a useful indicator for seeing the volatility of a market price. If a price is stable the Donchian channel will be relatively narrow. If the price fluctuates a lot the Donchian channel will be wider. Its primary use, however, is for providing signals for long and short positions. If a security trades above its highest n periods high, then a long is established. If it trades below its lowest n periods low, then a short is established.
Surce: https://en.wikipedia.org/wiki/Donchian_channel
The indicator has two parameters:
- Computed From – refers to the source of the price data on each bar
- Period – refers to the number of periods on which indicator is calculated
The indicator has three lines:
- Upper Band
- Middle Band
- Lower Band
Indicator is implemented for: MT4/MT5/Tradestation/ Multicharts
You can download the indicator here.
Timothy Masters Internal Profit Factor
When evaluating the success of a trading strategy, a strategy developer can use a large number of strategy metrics. One of them is the profit factor. Profit Factor may be defined as:
The profit factor is defined as the gross profit divided by the gross loss (including commissions) for the entire trading period. This performance metric refers to the amount of profit per unit of risk, with values greater than one indicating a profitable system.2 For example, the strategy performance report shown in Figure 1 indicates that the trading system tested has a profit factor of 1.98.
This is calculated by dividing the gross profit by the gross loss:
$149,020 ÷ $75,215 = 1.98
Source: https://www.investopedia.com
It is a simple, robust, and standardized metric. In the book Statistical Sound Indicators For Financial Market Prediction, author Timothy Masters has developed a new method for calculating the profit factor. Let me quote directly from his book
Suppose that a position is taken and maintained for five bars. And the following sequence of individual bar return is obtained : +1 +3 -2 -2 +1 . Then we have string of returns Then we have one more sting of returns from a position taken and maintained later: +2,-,,+1. Recall that the profit factor is feined as the sum of winds divided by the sum of losses. With my method we have (+1,+3,+1,+2,1)/(2+2,+3) = 8/7 = 1,14 This is worthlessly small profit factor , which is not at all surprising since the net gain +1. But if you were the to pool each of those two contiguous positions, there would be two trades with a profit factor of 1/0 or infinite and seriously unstable overestimate of true probability of the system.
Master s Profit factor is calculated as the log of open price of the current bar minus of the log open price of the previous bar.
This snippet can be calculated thanks to the newly added ability to work with historical data in the upcoming version 136. When calculating the strategy metrics, we work with the orderlist class which stores the values of the given trades. Until now we didn’t have access to time series data before/during the trades, but thanks to the History Class loader we have.
You can find more information about this method in our blog post here
This method does not work for protected data ( futures and stocks ) from Barchart. It is important to note that working with data snippets is slower because the HistoryClass loading class is not so fast.
You can download the databank snippet here.
Databank columns – Additional Markets Strategy Metrics Average Values
83 Strategy metrics that calculate the average value of a given metric for all additional markets tested in the additional markets cross-check. Thanks to these snippets it is possible to better evaluate the performance of a strategy in different markets and can therefore be used to evaluate the robustness of a strategy.
More about Crosschecks in StrategyQuantX you can find here.
You can download databank columns snippets here
What If : Only Short Trades /What If : Only Short Trades
This what-if snippet allows you to simulate trading a strategy only with only Long or Only Short trades. More about What if simulations you can find here.
You can download What If – Only Short snippet here
You can download What If – Only Long snippet here
We will add new conditions based on new indicators when StrategyQuantX 137 will be released around the end of January.
You can easily do your conditions for new indicator in Custom blocks. More information you can find here:
How to import custom indicators to SQX:


 Ellie Souckova

this is really excellent !!!! it will be very useful to improve our results
Thank you very much
it is possible to create a column for median profit/loss from the main market?
If you want to have this feature added you can ask our dev team using this page https://strategyquant.com/codebase/request-coding/
Wow. Thank you so much ! I was just looking for a databank metric for all additional markets tested in the additional markets cross-check and the Donchian Channel.
Will it be included by default in the next SQX build ?