In the 131 build, We have added several indicators and conditions derived from them. They are currently implemented for Metatrader 4, Metatrader 5, Tradestation, and Multicharts.
Before reading this article, I recommend you read the part of the documentation that deals with building blocks under this link.
Reflex
This is a relatively new indicator presented in the January issue of TASC 2020. The author is John Ehlers is an engineer, author of many trading ideas, books.Many know him as a pioneer of quantitative trading in the trading community in the 1980s. You can see an interesting video with Ehlers on older data from 2013 here on the Futures.io webinar.
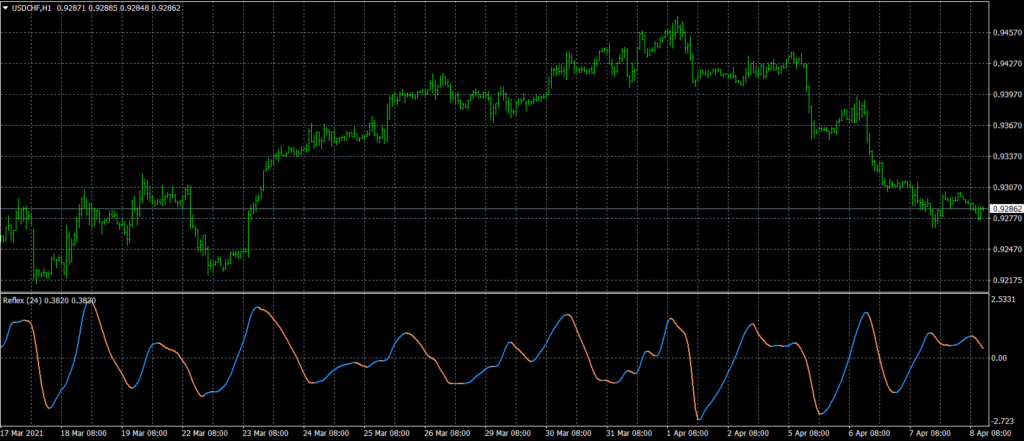
The calculation of the REFLEX indicator is somewhat difficult to explain. It is a momentum like indicator and it can be used to generate signals in a more timely manner than other lagging calculations. REFLEX has one configurable parameter – Reflex Period and oscillates around zero in the range -2 to 2.
Indicator Reflex
We have added these basic conditions:
Reflex is Rising / Reflex is Falling
Reflex change the direction UP / Down
Faster Reflex is above/below Slower Reflex
I recommend displaying the indicator in one of the platforms and watching it on different time frames and markets.
Laguerre RSI
Laguerre RSI (LRSI) is another indicator of John Ehlers, or better – his interpretation of RSI. Again, the explanation of his code is a bit complicated and beyond the scope of this article. If you are interested, you can read this material directly from his website on this link.
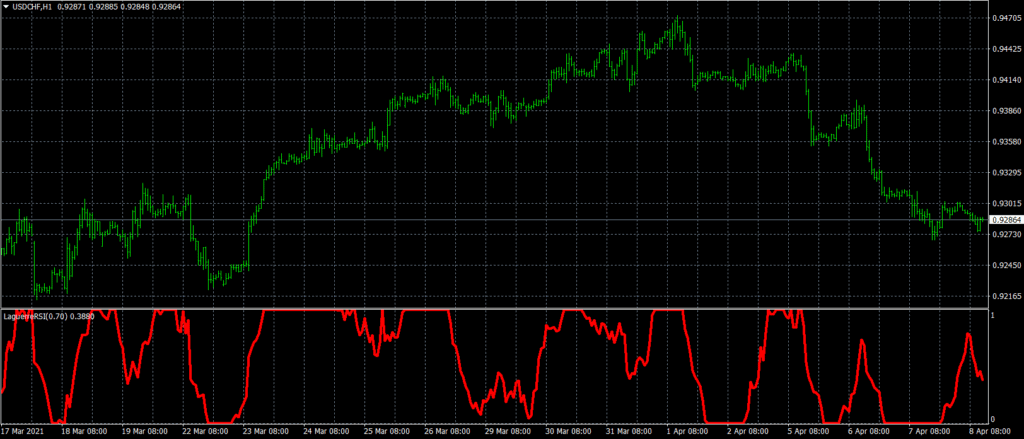
However, its main benefit was to reduce false signals while maintaining the ability to react quickly to price changes. LRSI is an oscillator that swings between 0-1 and has a single parameter – Gamma.The setting with a lower Gamma value is used as a “classic oscillator”, i.e. open position when the indicator exceeds xy. The setting with a higher Gamma allows the LRSI to be used as a trend indicator.
Jeff Swanson from easylanguagemastery.com has done a short comparison of LRSI and classic RSI and showed that LRSI can give better results with lower risk (number of trades and DD) (higher PF and NET profit). You can find the whole article here.
We have added these basic conditions:
LRSI is Rising / is Falling
LRSI changes direction downwards / upwards
LRSI is crossing Level Up / Down
Laguerre RSI
SuperTrend
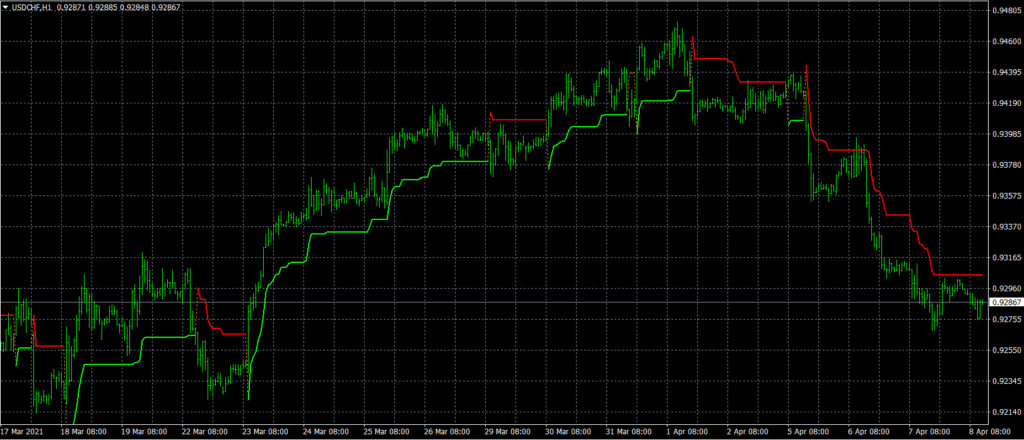
SuperTrend is an excellent indicator, mainly because of its simplicity and the fact that it combines price action and volatility. ATR is used to measure the current average volatility, which is then multiplied by the multiplier value. The indicator basically shows a direction when the price moves and makes a large enough move that is equal to or greater than three times the current average volatility. You can set two parameters: ATR length and ATR multiplier. There is another paramater – Mode for possible future updates of calculation of the indicator.
Supertrend can also help identify the range market, if its curve is vertical. Similarly, it can be used to identify support resistance levels.
We have added these basic conditions:
Bar Closes Above / Below SuperTrend
SuperTrend is Rising/Falling
SuperTrend is in Range
SuperTrend
Greater Count/Lower Count
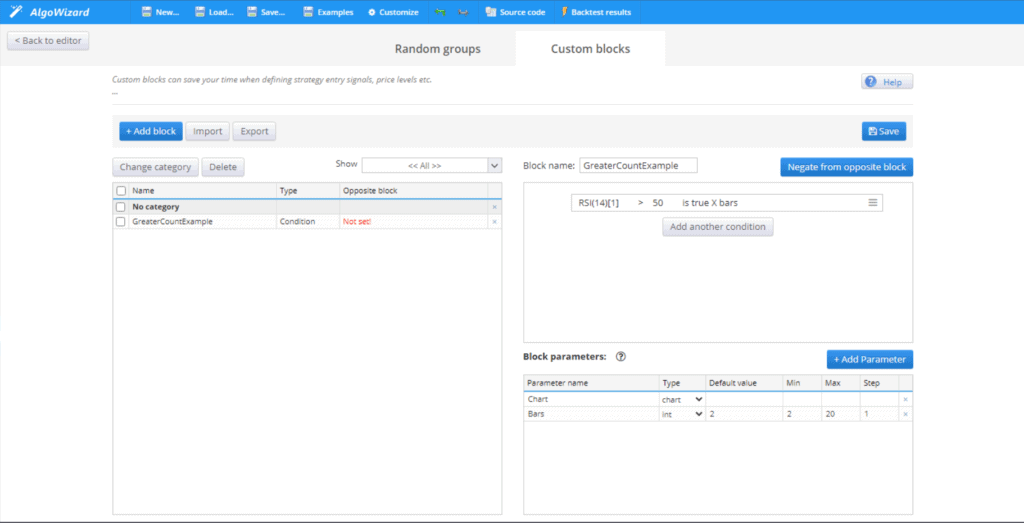
In SQX 131, we have also added two new comparison blocks. Comparison blocks are not indicators, but blocks that are used to create a condition or make a comparison between values during the genetic building process. The principle of the two blocks is that they count the number of bars when the condition x >= y or x <= y is met. Under x, y you can substitute the value of an indicator or another variable.
These comparison blocks are mainly intended for creating consecutive blocks in the Algowizard.
You can easily create these type conditions:
Close [1] > Close [2] is true for X bars.
RSI is above or equals 50 for X bars
SR Percent Rank i above 20 for X bars
High[1]==HighDaily[0] for X bars
You can also use these comparison blocks as input to the genetic search engine as a building block. In this case, it is important to keep in mind that there are several billion possible combinations, so it is better to determine what type of strategy you expect in this process and determine the indicators and ranges of their parameters based on that. Example: trend following strategies do not make much sense with very low moving averages periods , on the contrary, for a mean reversion swing strategy an RSI with a period of 100 will probably not be beneficial.
You can find a good tutorial on how to use custom blocks on the under this link.
Greater Count/Lower Count
Ulcer index
It is a potentially very useful indicator as it shows the depth and duration of a price fall or rise. Again it is simple and mainly uses price action in its calculation. It was originally used in stock market analysis, where it is used for the length and part of the duration of the time series decline. The author of the formula – Peter Martin characterizes the Ulcer index as follows:
“Ulcer Index measures the depth and duration of percentage drawdowns in price from earlier highs. The greater a drawdown in value, and the longer it takes to recover to earlier highs, the higher the UI. Technically, it is the square root of the mean of the squared percentage drawdowns in value. The squaring effect penalizes large drawdowns proportionately more than small drawdowns.”
In StrategyQuant X, the indicator is implemented to measure both downside and upside risk. This is because of the nature of Forex Market – currencies are traded in pairs.
More information about the calculation can be found under this link.
Indicator has two modes:
UI Mode = 1 Downside risk
UI Mode = 2 Upside risk
Another adjustable parameter is the UI period – length for which the Ulcer Index is calculated.
Please note that we have added Ulcer Index and Ulcer Performance Index as a databank columns, so you can evaluate your strategies this way as well. Good material with some research can be found under this link.
Ulcer index
Support/Resistance Percent Rank
I created this indicator in December, until now I have not found the same indicator with the original autor on the internet. SR Percent Rank helps to see how many times the current close price has been in the past price range.
The indicator makes a loop over x bars into the past and calculates the percentage of times the current closing price has been between the high and the closing price in the x bars before that.
Indicator has two modes:
Percentage occurrence of current close between high and low X bars back
Percentage occurrence of current close between high + Current ATR and low – Current ATR X bars back.
Thanks to this, we can determine the percent rank of current close price occurrences in the range of past prices and assume that we are in the support, resistance or breakout zone.
We have added these basic conditions:
SR Percent Rank is above/below level
SR Percent Rank is above / below level for X bars
Support/Resistance Percent Rank
Conclusion
You can set and customize all the indicators. You can find instructions on how to configure them on the StrategyQuant page in the Documentation section under this link
A very important part of working with the indicators and snippets is the ability to create your own custom blocks. For example, you can make all existing blocks into multi timeframe blocks with a few clicks per block and you will be able to create strategies without additional subcharts.
In the next blog post, we’ll take a closer look at some of the indicators and prepare some effective custom blocks.
Ivan Hudec, known as “Clonex” on the forum, is an experienced algorithmic trader, consultant, and researcher who has been trading for 15 years and using StrategyQuant X (SQX) since 2014. He contributes to the SQX blog and enhances the software by adding new indicators, snippets, and incorporating Python programming for advanced data analysis, machine learning algorithms, and quantitative modeling. Ivan offers his expertise to help others accelerate their trading projects and approach them in innovative ways.
Hi Clonex,
Thanks for your wonderful work on these indicators.
I have noticed a syntax error that keeps appearing in my MT5 Source codes relating to the ulcer index. It has an additional comma in the code which causes the MT5 compiler to fail. I have been modifying the source codes myself and deleting the extra comma and it works fine after that.
Just thought I’d bring it to everyone’s attention.
Thanks again.
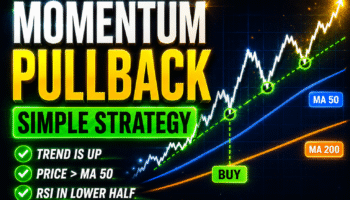
Most traders overcomplicate momentum trading. More indicators. More filters. More rules. But what if a strategy built from just a few simple ideas could outperform the benchmark while spending less …
Most StrategyQuant users never create their own custom blocks or strategy templates. And honestly, it’s easy to understand why. Building custom blocks traditionally means working with AlgoWizard, understanding the structure …
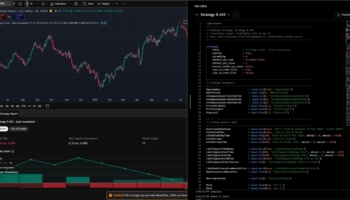
The Source Code Translator is a Results Plugin for StrategyQuant X that lets you translate any strategy’s source code into 15 different trading platform languages — directly from the Results tab, in one click


 Tomas Vanek
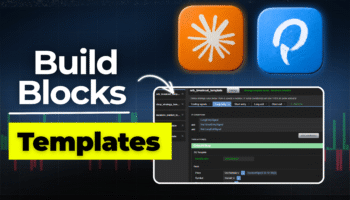

Excellent ! Thank you
Clonex, This is really Excellent !!!!!!!!!!!!
Hi Clonex,
Thanks for your wonderful work on these indicators.
I have noticed a syntax error that keeps appearing in my MT5 Source codes relating to the ulcer index. It has an additional comma in the code which causes the MT5 compiler to fail. I have been modifying the source codes myself and deleting the extra comma and it works fine after that.
Just thought I’d bring it to everyone’s attention.
Thanks again.