We have added several new indicators and snippets to the sharing server in recent months. In today’s blog post, we’ll briefly go through each of them. All indicators work only in StrategyQuant X Build 137 and higher. They may not work in earlier versions. At the time of writing, 137 Build Relase Candidate 4 is available for download here.
Casey C%
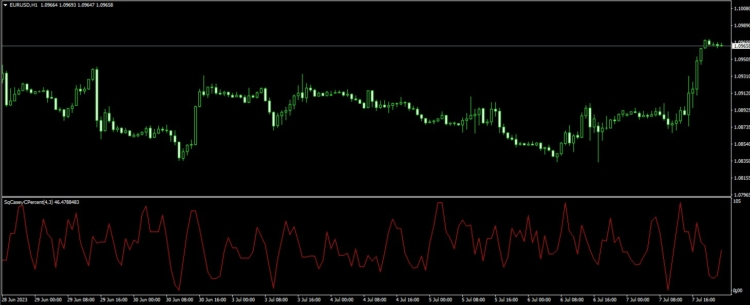
Casey C% is a momentum oscillator that measures the speed and change of price movements. It’s often used to identify overbought or oversold conditions in a market, which could signal a potential reversal in price, making it a useful tool for mean reversion strategies. It is used by traders to identify potential trading opportunities. The indicator was created by Ali Casey , our partner and SQX educator.
The indicator has one line:
- Casey Percent
The indicator has these parameters
- Lookback – Oscillator calculation period
- SmoothLen – Averaging period
Indicator is implemented for: MT4/MT5/Tradestation/ Multicharts.
You can download the indicator and conditions here.
Volume Weighted Average Price Bollinger Bands – VWAPBB
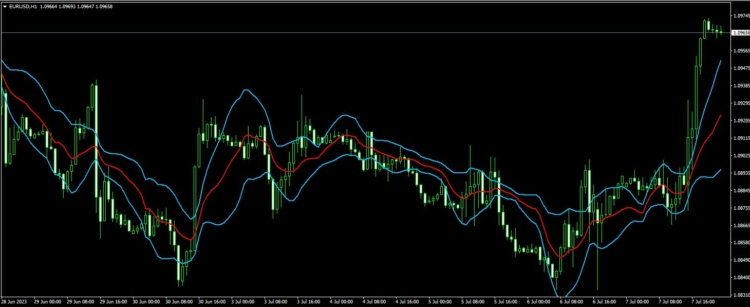
Volume Weighted Average Price (VWAP) Bollinger Bands is a technical analysis indicator that combines the concepts of Volume Weighted Average Price (VWAP) and Bollinger Bands to create dynamic support and resistance levels, or “bands”, around the VWAP line. This indicator helps traders to gauge the volatility and price action around the VWAP, providing additional insights for potential trade setups.
Volume Weighted Average Price (VWAP): VWAP is a indicator used by traders that gives the average price a security has traded at throughout the day, based on both volume and price. It is important because it provides traders with insight into both the trend and value of a security. VWAP is calculated by adding up the dollars traded for every transaction (price multiplied by the number of shares traded) and then dividing by the total shares traded for the day.Bollinger Bands: Bollinger Bands is a volatility indicator developed by John Bollinger that consists of three lines: a simple moving average (middle band) and two standard deviations above (upper band) and below (lower band) the moving average. The bands widen or narrow based on the volatility of the security’s price, with higher volatility leading to wider bands and lower volatility leading to narrower bands.
To create VWAP Bollinger Bands, you would first calculate the VWAP line and then apply the Bollinger Bands methodology using the VWAP as the middle line (instead of the simple moving average). This means calculating the standard deviation of the price based on a specific period and then adding or subtracting a multiple of the standard deviation (typically two) from the VWAP to form the upper and lower bands.
VWAP Bollinger Bands can be used in various ways, such as identifying potential entry and exit points, setting stop-loss and take-profit levels, and evaluating the strength of trends. They can also be used to determine whether the price is relatively high or low compared to the VWAP. Keep in mind, though, that like any technical indicator, VWAP Bollinger Bands should be used in conjunction with other tools and analysis techniques to improve trading decisions.
The indicator has two lines:
- VWAP Upper
- VWAP Lower
The indicator has these parameters
- VWAP Period – Lookback Period of VWAP
- Deviation– Multiplication of the STDEV from the VWAP
Indicator is implemented for: MT4/MT5/Tradestation/ Multicharts
You can download the indicator here.
Volume Weighted Average Price ATR Bands – VWAPAB
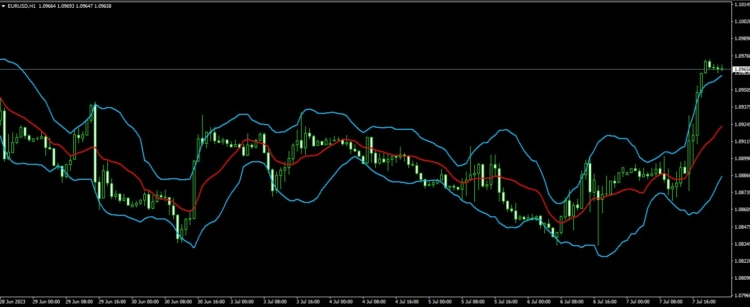
Volume Weighted Average Price (VWAPAB) ATR Bands is a technical analysis indicator that combines the concepts of Volume Weighted Average Price (VWAP) and Average True Range (ATR) to create dynamic support and resistance levels, or “bands”, around the VWAP line. This indicator helps traders to gauge the volatility and price action around the VWAP, providing additional insights for potential trade setups.
Volume Weighted Average Price (VWAP): VWAP is a trading indicator used by traders that gives the average price a security has traded at throughout the day, based on both volume and price. It is important because it provides traders with insight into both the trend and value of a security. VWAP is calculated by adding up the dollars traded for every transaction (price multiplied by the number of shares traded) and then dividing by the total shares traded for the day.
Average True Range (ATR): ATR is a volatility indicator developed by J. Welles Wilder Jr. that measures the degree of price movement or volatility within a specific period. ATR is calculated by taking an average of the true ranges, which are the greatest of the following: the current high minus the current low, the absolute value of the current high minus the previous close, or the absolute value of the current low minus the previous close.
To create VWAP ATR Bands, you would first calculate the VWAP line and then add or subtract a multiple of the ATR from the VWAP. This multiple is typically a user-defined parameter that can be adjusted according to the desired sensitivity of the bands. The result is an upper and lower band that represents a range around the VWAP, which can be used to identify potential support and resistance levels or to gauge the strength of price moves relative to the VWAP.
VWAP ATR Bands can be used in various ways, such as identifying potential entry and exit points, setting stop-loss and take-profit levels, and evaluating the strength of trends. Keep in mind, though, that like any technical indicator, VWAP ATR Bands should be used in conjunction with other tools and analysis techniques to improve trading decisions.
The indicator has two lines:
- Upper
- Lower
The indicator has these parameters
- VWAP Period – Lookback Period of VWAP
- Multiplication – Multiplication of the ATR Bands ( Lower and Upper ) from the VWAP
Indicator is implemented for: MT4/MT5/Tradestation/ Multicharts
You can download the indicator here.
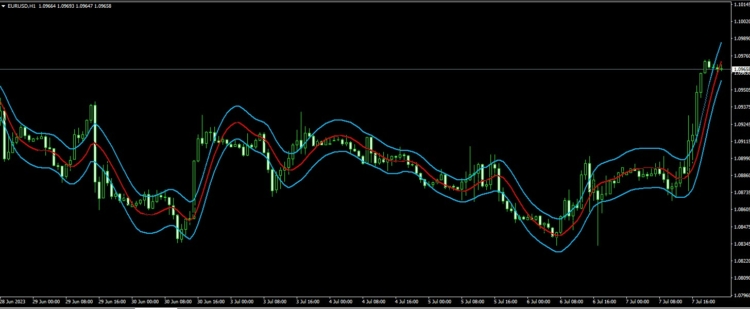
Hull Moving Average Bollinger Bands – HMABB
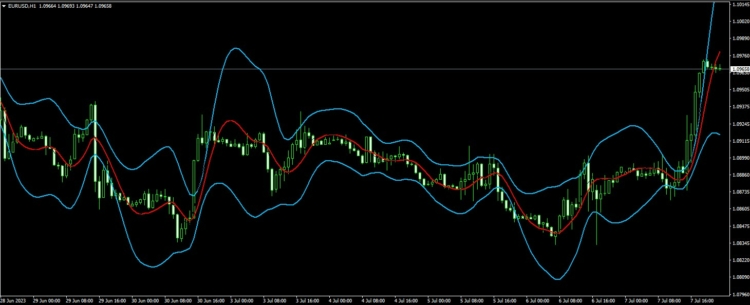
Hull Moving Average (HMA) Bollinger Bands is a technical analysis indicator that combines the concepts of Hull Moving Average (HMA) and Bollinger Bands to create dynamic support and resistance levels, or “bands,” around the HMA line. This indicator helps traders gauge the volatility and price action around the HMA, providing additional insights for potential trade setups.
Hull Moving Average (HMA): The Hull Moving Average, developed by Alan Hull, is a fast and smooth moving average designed to reduce lag and improve responsiveness compared to traditional moving averages. The HMA is calculated by taking the weighted moving average (WMA) of the midpoint (half of the period) and subtracting the WMA of the full period. Then, a WMA of the square root of the period is taken from the result. This calculation reduces lag and provides a more responsive moving average line.
Bollinger Bands: Bollinger Bands is a volatility indicator developed by John Bollinger that consists of three lines: a simple moving average (middle band) and two standard deviations above (upper band) and below (lower band) the moving average. The bands widen or narrow based on the volatility of the security’s price, with higher volatility leading to wider bands and lower volatility leading to narrower bands.
To create HMA Bollinger Bands, you would first calculate the HMA line and then apply the Bollinger Bands methodology using the HMA as the middle line (instead of the simple moving average). This means calculating the standard deviation of the price based on a specific period and then adding or subtracting a multiple of the standard deviation (typically two) from the HMA to form the upper and lower bands.
HMA Bollinger Bands can be used in various ways, such as identifying potential entry and exit points, setting stop-loss and take-profit levels, and evaluating the strength of trends. They can also be used to determine whether the price is relatively high or low compared to the HMA. Keep in mind, though, that like any technical indicator, HMA Bollinger Bands should be used in conjunction with other tools and analysis techniques to improve trading decisions.
The indicator has two lines:
- Upper
- Lower
The indicator has these parameters:
- ComputedFrom – Type of price series from which the HMA is calculated
- Period – Lookback Period of HMA
- Deviation– Multiplication of the STDEV from the HMA
Indicator is implemented for: MT4/MT5/Tradestation/ Multicharts
You can download the indicator here.
Hull Moving Average ATR Bands – HMAATRB
Hull Moving Average (HMA) ATR Bands is a technical analysis indicator that combines the concepts of Hull Moving Average (HMA) and Average True Range (ATR) to create dynamic support and resistance levels, or “bands”, around the HMA line. This indicator helps traders to gauge the volatility and price action around the HMA, providing additional insights for potential trade setups.
Hull Moving Average (HMA): The Hull Moving Average, developed by Alan Hull, is a fast and smooth moving average designed to reduce lag and improve responsiveness compared to traditional moving averages. The HMA is calculated by taking the weighted moving average (WMA) of the midpoint (half of the period) and subtracting the WMA of the full period. Then, a WMA of the square root of the period is taken from the result. This calculation reduces lag and provides a more responsive moving average line.
Average True Range (ATR): ATR is a volatility indicator developed by J. Welles Wilder Jr. that measures the degree of price movement or volatility within a specific period. ATR is calculated by taking an average of the true ranges, which are the greatest of the following: the current high minus the current low, the absolute value of the current high minus the previous close, or the absolute value of the current low minus the previous close.
To create HMA ATR Bands, you would first calculate the HMA line and then add or subtract a multiple of the ATR from the HMA. This multiple is typically a user-defined parameter that can be adjusted according to the desired sensitivity of the bands. The result is an upper and lower band that represents a range around the HMA, which can be used to identify potential support and resistance levels or to gauge the strength of price moves relative to the HMA.
HMA ATR Bands can be used in various ways, such as identifying potential entry and exit points, setting stop-loss and take-profit levels, and evaluating the strength of trends. Keep in mind, though, that like any technical indicator, HMA ATR Bands should be used in conjunction with other tools and analysis techniques to improve trading decisions.
The indicator has two lines:
- Upper
- Lower
The indicator has these parameters
- ComputedFrom – Type of price series from which the HMA is calculated
- Period – Lookback Period of HMA
- Multiplication – Multiplication of the ATR Bands ( Lower and Upper ) from the HMA
Indicator is implemented for: MT4/MT5/Tradestation/ Multicharts
You can download the indicator here.
Percentile Rank Comparison Blocks
In February we added new comparison blocks to the sharing server IsGreater Percentile/Is Lower Percentile. These comparison blocks allow you to create rules based on the percentile rank of a given indicator. The main advantage is the possibility to create normalized blocks from the indicators in Algowizard. We have devoted a whole blog post to these comparison blocks where their use is discussed in more detail. You read the whole post here.
You can download the comparison blocks here.
ATR Trailing Stops – ATS
The ATR Trailing Stops indicator is a combination of the ATR (Average True Range) and a trailing stop. The Average True Range is a volatility measurement that helps traders understand the average range of price movements over a specified period. By combining this information with a trailing stop, traders can dynamically adjust their stop loss levels based on market volatility. This can help them avoid getting stopped out too early due to minor market fluctuations while still protecting their profits. We have devoted a whole blog post to this indicator blocks whereit is discussed in more detail. You read the whole post here.
You can download the indicator here.
Strategy Metrics Out Of Sample / In The sample Ratios
The OOS/IS ratio expresses the degree of degradation of the strategy in the Out Of The Sample Period versus the IS Period. Strategy degradation refers to the decline in a trading strategy’s performance when it is applied to new, unseen data. This degradation often occurs when a strategy that has been optimized and fine-tuned on In-Sample (IS) data is tested on Out-of-Sample (OOS) data. The degradation can be a result of overfitting the strategy to the IS data or due to changing market conditions that the strategy is not able to adapt to.
Out-of-Sample (OOS) and In-Sample (IS) ratios are crucial concepts in the development, testing, and validation of trading strategies. These ratios help assess the robustness of strategies and ensure that they are not overfit to a specific data set. The following is an extensive explanation of OOS/IS ratios:
Purpose of OOS/IS Ratios: The primary goal of using OOS/IS ratios is to assess the robustness and generalizability of trading strategies. By evaluating the strategy’s performance on both IS and OOS data, users can identify potential overfitting and ensure that the strategy is not overly optimized for a specific data set. A strategy that performs well on both IS and OOS data is more likely to be resilient and adaptable to changing market conditions.
You can download databank columns snippets here
All indicators work only in StrategyQuant X Build 137 and higher. They may not work in earlier versions. At the time of writing, 137 Build Relase Candidate 4 is available for download here
We will add new conditions based on new indicators when StrategyQuantX 137 will be released.
You can easily do your conditions for new indicator in Custom blocks. More information you can find here:
How to import custom indicators to SQX:

 Tomas Vanek