Documentation
Applications
Last updated on 5. 5. 2015 by Mark Fric
Add new statistical value
Page contents
in this example we’ll extend Quant Analyzer and add a new statistical value.
All statistical values such as Number of trades, Net Profit, Return / DD, Sharpe ratio, CAGR, etc. are implemented as snippets – a pieces of Java code that implements some functionality, in our case it will compute new value in the program.
This means the program can be easily extended with new value.
In this example we’ll create a new statistical value named V Ratio.
It is computed as a ratio between maximum drawdown in money and average monthly profit.
It essentially expresses how many months in average it takes to recover from maximum drawdown, the higher value is better.
For example, if max drawdown is $500, and average monthly profit is $100, V Ratio is computed as
100/500 = 0.2
In this example we’ll show how to:
-
1. Work with QuantEditor where we can create new snippets
-
2. Create new statistical value V Ratio, which will be computed for every report loaded to the program
-
3. Add this value to available databank columns, so it will be visible also in databank
-
4. Create a new custom databank view with the new column
-
5. Create a custom Analyzer → Overview template that displays out new value
1. Working with QuantEditor
QuantEditor is a build-in editor for snippets that you can use to create/modify new snippets and look at the source code of the existing ones.
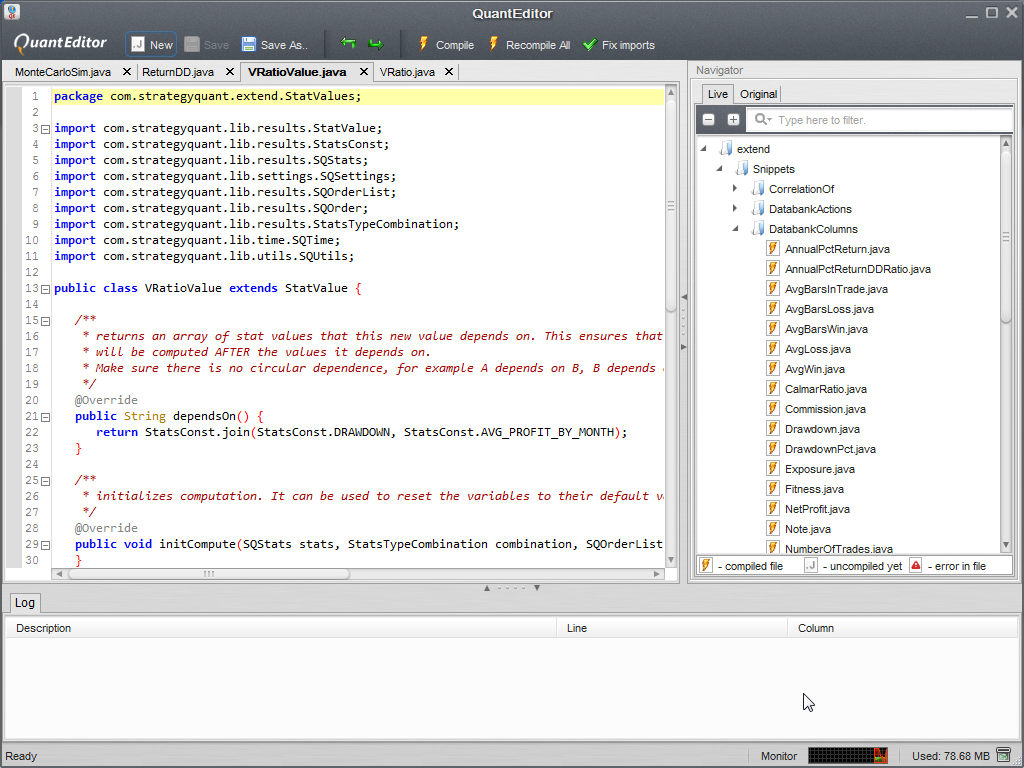
It can be started from the program using QuantEditor icon on the toolbar.

2. Creating a new stats value
As the very first step we have to create a new snippet that will compute our V Ratio value.
So let’s start Quant Editor, go to its Navigator panel and find /extend/Snippets/StatsValues. There click on StatsValues with right mouse button and choose New File action.

Name the new snippet VRatioValue.
QE (QuantEditor) will create a new snippet with the required structure of the code and default methods.
Now we only need to add the computation to the correct place and save the value.
Let’s go through the methods in the snippet one by one:
dependsOn()
this method allows us to set dependencie – if the value we are trying to compute depends on some other stat values that have to be computed earlier. This is our case, we need values for max drawdown and average monthly profit computed beforehand, so we’ll add them to this method:
public String dependsOn() {
	return StatsConst.join(StatsConst.DRAWDOWN, StatsConst.AVG_PROFIT_BY_MONTH);
}
initCompute()
this method is called in the beginning of statistics computation.
We can use it to set initial values of some parameters, but we don’t need this in our case, so we’ll leave it empty:
public void initCompute(SQStats stats, StatsTypeCombination combination, SQOrderList ordersList, SQSettings settings, SQStats statsLong, SQStats statsShort) throws Exception {}
computeForOrder()
this method is called for every order in the list of orders.
It can be used if we compute stats from orders, but in our case we simply make ratio of two already precomputed values, so we’ll leave it empty as well:
public void computeForOrder(SQStats stats, StatsTypeCombination combination, SQOrder order, SQSettings settings) throws Exception {
}
endCompute()
this method is called at the end of the computation, it sets the computed values in SQStats object that is used in the program.
Every action here is commented and easy to understand.
public void endCompute(SQStats stats, StatsTypeCombination combination, SQOrderList ordersList, SQSettings settings, SQStats statsLong, SQStats statsShort) throws Exception {
   // get values of drawdown and avg profit per month that were already computed in their own snippets
   double drawdown = stats.getDouble(StatsConst.DRAWDOWN);
   double avgProfitByMonth = stats.getDouble(StatsConst.AVG_PROFIT_BY_MONTH);

   // compute V Ratio - we are using safeDivide() method to avoid
   // dividing by zero errors in case that avg profit per month is 0
   double vRatio = SQUtils.safeDivide(avgProfitByMonth, drawdown);

   // add the new stat value to the statistics.
   // Each value much have its own unique string key, we named ours "VRatio"
   // we also round this value to two decimal places
   stats.set("VRatio", SQUtils.round2( vRatio ));
}
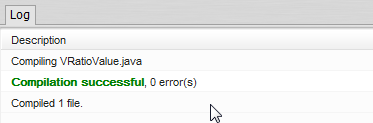
That’s it. We created new stats value that will be computed for every loaded report.
Now hit Compile and the new snippet should be compiled without any error.
3. Add this new value to databank columns
we have created new VRatio value, and it is computed for every report, but it is not yet visible anywhere.
If you’ll check your databank or overview you’ll not see it there because it wasn’t added to the databank columns yet.
Databank columns are snippets as well, there is one snippet for each column. This means it is easy to add new custom column to the databank.
So again, in QE Navigator open /extend/Snippets/DatabankColumns. There click with right mouse and choose New File, name it VRatio.
This created default VRatio column snippet, we can again go through its methods.
VRatio()
this is a class constructor, here you can specify column name that will be visible in databank header, ts tooltip and width.
public VRatio() { super();setName(L.t("VRatio"));setTooltip(L.t("VRatio"));setWidth(60);}
getValue()
method that is used to retrieve value for this column. In our case the value is stored in SQStats,
so we first have to get the result, and from there get the stats. Then we can get value of VRatio from stats.
public Object getValue(SQResultsGroup strategyResults, String dataType, String direction, String sampleType, String plType) throws Exception {
    // get result for portfolio
    SQResult result = strategyResults.getResult(SQConst.SYMBOL_PORTFOLIO);

    // get stats for portfolioand the correct combination of direction, pl type, sample type
    SQStats stats = result.getStats(direction, getCorrectPlType(plType), sampleType);
    if(stats==null) throw new StatsMissingException();

    // returns the value
    return stats.getDouble("VRatio", 0);
 }
displayString()
method that displays string in the databank cell. It gets the value using our getValue() function and displays it with proper formatting.
public String displayString(SQResultsGroup strategyResults, String dataType, String direction, String sampleType, String plType) throws Exception {
    // retrieves value using getValue() method
    Double value = (Double) getValue(strategyResults, dataType, direction, sampleType, plType);

    return twoDecimalFormat(value); // display the number with two decimal points
}
That’s the whole snippet. We can compile it, it should compile again without any error.
By doing this all we added new column to the available columns that can be shown in the databank.
4. Create a custom databank view with the new column
In the part above we created new column. To actually see it in the databank we have to create a view that will contain this column.
Databanks in Quant Analyzer are fully customizable, you can use Views to control which columns should be displayed.
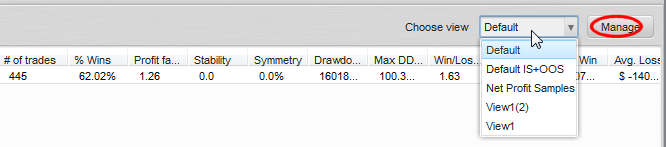
We have to create a new view that will contain our new column VRatio. Click to Manage button next to views in databank. We cannot edit the default view, so we have to create a new one. The easiest way to do is to clone the existing default view.
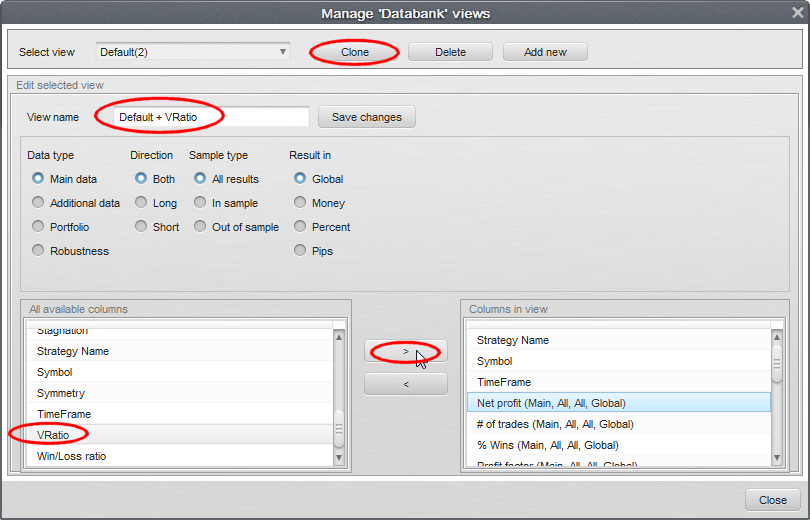
Click on the Clone button, this will create a new view with the same columns as default view. Let’s name it “Default + VRatioâ€. In the Available columns find our new column VRatio.
In the list on the right select Net profit (to add the new column right after Net profit) and click on > button.
This will add the column to the columns in this view. Now don’t forget to click on Save changes to safely save our new view. Then we can close this dialog.
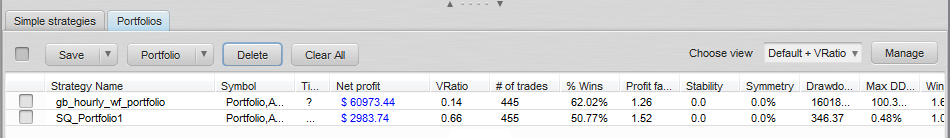
Now when you’ll open views again you’ll see the new view we just defined and we can select it.

Now when we’ll load some strategies we’ll see our new VRatio column properly computed and displayed.
5. Create a custom Analyzer → Overview template that displays out new value
now we can see our new VRatio value in the databank, but what if we want to see it also in the Analysis -> Overview window?
This is possible too. As many other things, Overview tab is controlled by snippets. Each template is implemented as a snippet that renders its own HTML file.
So every Overview template consists of snippet + HTML file template.

We have three possibilities how to display the value in Overview tab:
Editing an existing Overview snippet (not recommended)
we can modify one of the system default Overview snippets and make it display VRatio value instead of some other value we don’t need.
It is not recommended, because default system snippets can be changed in an update and your changes would be lost.
Creating a new Overview snippet that will use existing template
the second option is to create a new Overview snippet, but use the existing HTML template file. This has the advantage that our new snippet will be not modified by some future update.
The disadvantage is that since we’ll use existing HTML template file, we cannot add new value there. We can only display VRatio instead of some other value.
Creating new Overview snippet with new template
in this option we’ll make a new snippet and a new HTML rendering template. Here we are free to do anything we want, we can even use HTML that shows our own custom design.
In our example we’ll go with the second option – creating new snippet that uses existing HTML template.
So again in QuantEditor we’ll go to /extend/Snippets/OverviewTab and create new snippet called DefaultPlusVRatio.
This will create a new snippet that will implement new template for Overview tab.
We’ll again explain its methods, but first of all, we have to make one change. Because we basically want just to create a copy of SQDefault template, with only one value replaced, we’ll have to change the parent class of our new snippet from OverviewTemplate to SQDefault.
This means that our new snippet will be using all the methods of SQDefault and we have to implement only what’s different.
If we didn’t do this we’d have to write the code to replace all the values as same as it is done in SQDefault snippet.
So we’ll edit the line
public class DefaultPlusVRatio extends OverviewTemplate {
to
public class DefaultPlusVRatio extends SQDefault {
Now we can look at the rest of the methods.
DefaultPlusVRatio()
this is class constructor, it is called when snippet is created. We should define template name, screenshot image and HTML template file here
public DefaultPlusVRatio() {
   setName("DefaultPlusVRatio");

   // we'll copy the values below from SQDefault snippet, our new snippet will use the same HTML template
   // These files are located in /settings/plugins/OverviewTab
   setScreenshotName("sqdefault_screenshot.jpg");
   setHtmlTemplateName("sqdefault_template.htm");
}
drawValues()
it is the main function. It loads the HTML template file, replaces the constants there with proper labels and values and returns it to the program.
In our case we don’t need to change it at all.
public String drawValues(SQResultsGroup strategyResult, String symbol, StatsTypeCombination combination) throws Exception {
   template = loadTemplate();
   replaceValues(strategyResult, symbol, combination);

   return template;
}
replaceValues()
this function is called from drawValues() and it replaces the constants in HTML template with values computed by the program – they are stored in result -> stats
public void replaceValues(SQResultsGroup strategyResult, String symbol, StatsTypeCombination combination) {
   SQStats stats = null;
   SQResult result = null;

   // this first pars gets the appropriate stats values from the result
   // we can use the default code for this
   if(strategyResult!=null) {
      result = strategyResult.getResult(symbol);

      if(result!=null) {
         stats = result.getStats(combination);
      }
   }

   // here we replace constant 3_2 with our V Ratio value
   // if you'll check SQDefault snippet you'll see that it replaces 3_2 with R Expectancy
   // so in our template we'll display V Ratio instead of expectancy

   replace("3_2", "V Ratio", stats==null ? NA : d2(stats.getDouble("VRatio")));

   // in the end we have to call replaceValues() method of the parent class (SQDefault)
   // to replace all the remaining values
   super.replaceValues(strategyResult, symbol, combination);
}
This is all. Now compile this snippet and you’ll see new template in Analysis -> Overview.
When you’ll switch to it you’ll see that it now displays V Ratio in place where standard SQDefault template displays R Expectancy.

This was an example how to create new Overview template that displays our custom value.
If you have more than one custom values, it might be worth to create a copy of the HTML template and modify it so that it has one more line of values.
Remember, you can set your own file in snippet constructor in setHtmlTemplateName()
The HTML template files used in Overview snippets are located in /settings/plugins/OverviewTab/
Thats all in this tutorial.
We demonstrated how easy it is to extend QuantAnalyzer with new custom values and how to display them in databank and Overview.
Was this article helpful? The article was useful The article was not useful