Documentation
Applications
Last updated on 16. 12. 2019 by Mark Fric
Comparing results
Compare results is a new functionality in QuantAnalyzer.
It allows you to compare multiple results between your trading platform / live results and backtests in StrategyQuant / AlgoWizard.
You can do it also manually by loading each report into QA and then combining it in portfolio, but this new module can do it automatically for you for all the files in your folders.
There is a new icon Compare results on the top left.
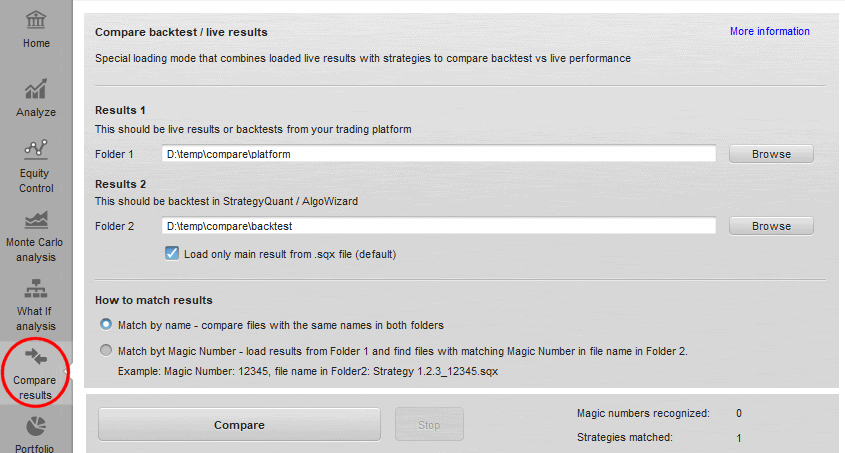
Its configuration is simple – you have to choose:
Folder 1
folder that contains live results or backtests from your trading platform – Tradestation, MetaTrader, MyFxbook, FxBlue etc.All the formats that QA recognizes are supported
Folder 2
contains backtest of strategies from StrategyQuant / AlgoWizard. It recognizes .sqx and .str format.
There is also a checkbox “Load only main result”. It is because .sqx file can contain multiple results from cross checks or additional markets.They would be loaded together as a portfolio if you uncheck this option. By default it should stay checked
How to match results
Match by name – means that for every file in Folder 1 it will try to find file with the same ame in Folder 2.When found, these two results are then combined into portfolio.
Match by Magic Number – can be used when you have reports for example from MyFxbook / FxBlue that contain list of trades for multiple strategies, distinguished by their Magic Number.
With this option it will recognize all Magic numbers from reports loaded from Folder 1, and it will try to find strategies in Folder 2 that have this Magic Number in their name.
So for example if Magic Numbers are 12345, 76543 then it will look for files with strings “12345” and “76543” in their names in Folder 2. If found, it will combine these found results into one portfolio.
When you click on Compare button it will perform the comparison and writes the log.All the comparison results are stored into Portfolios databank.
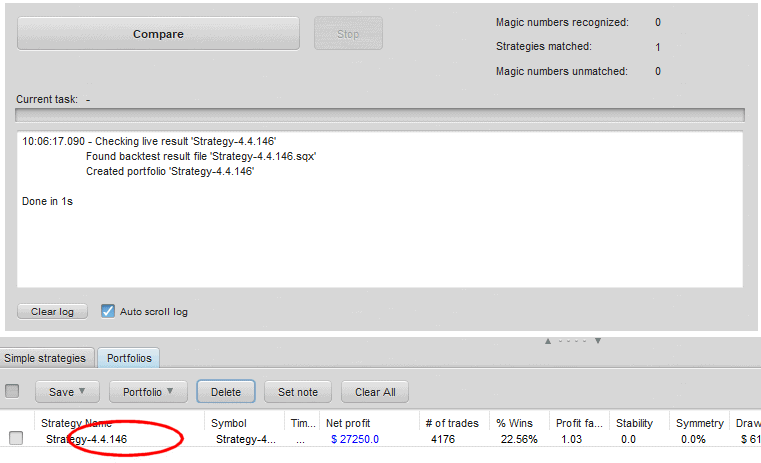
When you double-click on it and open it in Equity chart in Analyze you can visually compare equities and other stats of these two results.
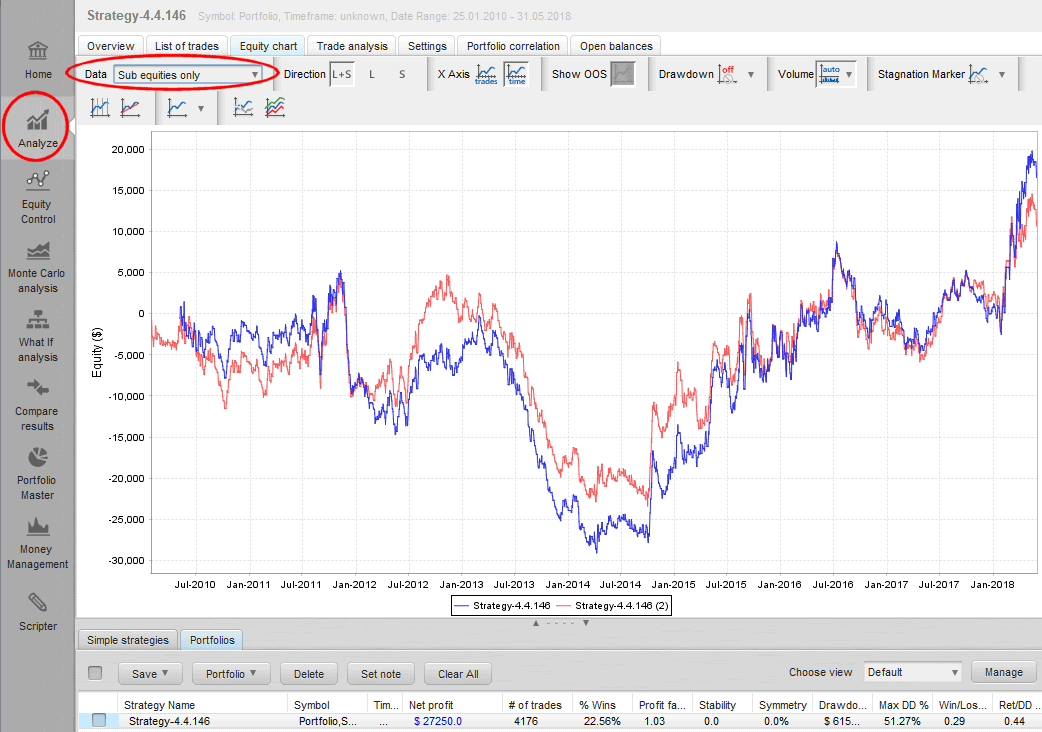
In my example I compared backtest of strategy in Tradestation (first blue line) with backtest in StrategyQuant (second, red line).
We can see there were some differences in trading but the equities are quite close to each other.
Was this article helpful? The article was useful The article was not useful
Can this be used to compare live results with an MT4 terminal strategy tester backtest?
Yes, here is the link for extended tutorial: https://strategyquant.com/blog/real-trading-compare-live-strategy-results-backtest/