Documentation
Applications
Last updated on 19. 6. 2023 by tomas262
Open Balances analysis
Page contents
In QuantAnalyzer, the “Open Balances” function is used to analyze profit and loss values of your trades. It computes real open unrealized profit/loss values for your trades and tells you real drawdown the strategy reached. The feature is important for trades that want to know real open profit and loss made by strategies.
By default QuantAnalyzer does not show open loss and profit for trades loaded through reports. Drawdown and other statistical values are based on closed transactions only. Using the open balance you can evaluate real risk exposure of your trades and size properly. It is especially useful when trading margined products where excessive risks needs to be avoided.
Here are steps you need to follow to run the analysis in QuantAnalyzer
#1 – Launch QuantAnalyzer
First please ensure that you have the latest version installed or download the latest QuantAnalyzer version
#2 – Load a report
In QuantAnalyzer, you work with projects that contain your trading data and analysis. You can load reports from various trading platforms or even unsupported ones! If you are not sure about supported platforms check our list of supported platforms for QuantAnalyzer

#3 – Import 1 minute data
To utilize the “Open Balances” function, you need to have your trading OHLC 1 minute data imported into the project. QuantAnalyzer supports various file formats such as CSV. The “minutedata” folder inside the QuantAnalyzer installation folder is used to store minute-level data for various financial instruments. This folder is created by QuantAnalyzer to organize and manage the historical minute data that is downloaded or imported into the software.
If you do not have the data available yet you can use our solution such as QuantDataManager or StrategyQuantX to get high quality 1-minute data from supported brokers such as Dukascopy or Darwinex and others.
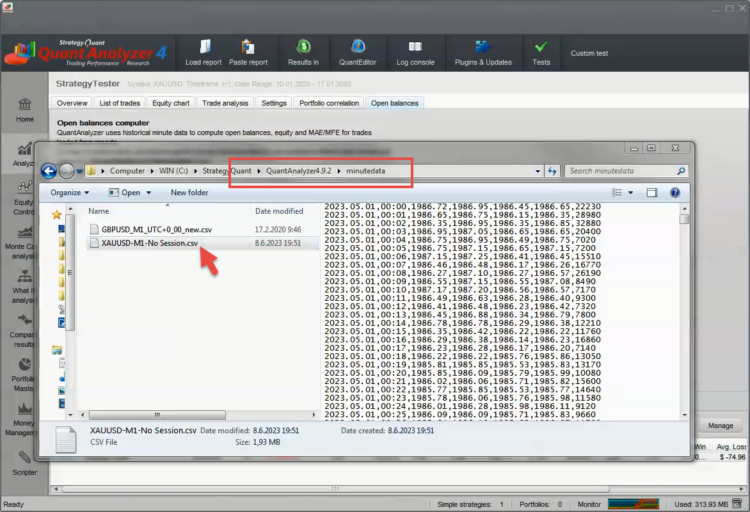
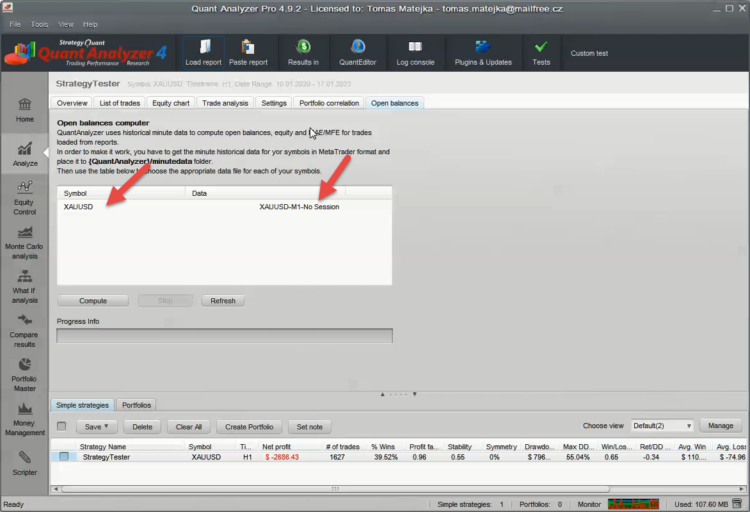
#4 – Once you have the data loaded verify you can see it under the list and can be used
Make sure you can see the data loaded into QA. You can hi the Refresh button to reload the content of the data folder mentioned.
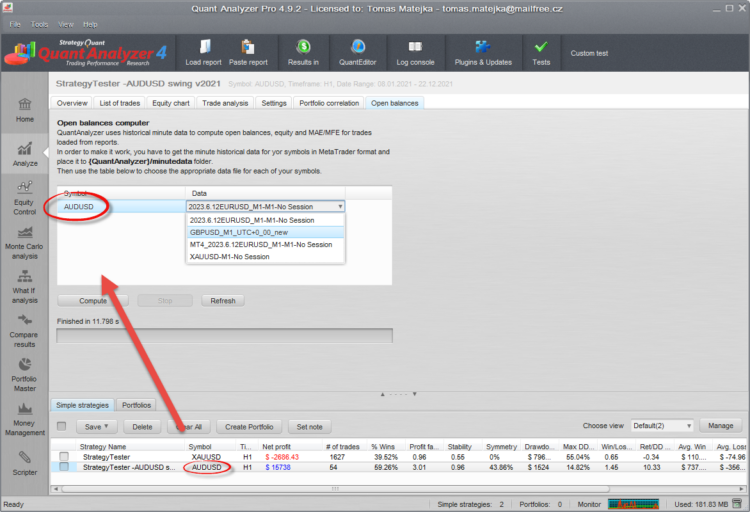
NOTE: QuantAnalyzer show only the data based on strategy selected in the databank to have a symbol match. See 2 following pictures below:
You can even select various data sources (files) for the same symbol using the right menu
#5 – Run the computation process
Now you can hit the Compute button. It will take some time to compute depending or how much data is being used.
#6 – View analysis results in your chart. For details how to setup the view the see the Max Open Drawdown value see the video-clip
Was this article helpful? The article was useful The article was not useful
Hi Tomás, How can I add a new column in the list of trades with open balance?
See the end of the video. I show how to add new columns
Hi
Not work
CSV from QuantDataManager QuantDataManagerQuantDataManager
java.lang.Exception: Failed to load data. Reason: 5
at com.strategyquant.plugin.Analyzer.impl.OpenBalances.logic.DataLoader.readData(DataLoader.java:61)
at com.strategyquant.plugin.Analyzer.impl.OpenBalances.logic.DataLoader.load(DataLoader.java:89)
at com.strategyquant.plugin.Analyzer.impl.OpenBalances.logic.OpenBalancesTask.loadSymbolsData(OpenBalancesTask.java:325)
at com.strategyquant.plugin.Analyzer.impl.OpenBalances.logic.OpenBalancesTask.doInBackground(OpenBalancesTask.java:107)
at com.strategyquant.plugin.Analyzer.impl.OpenBalances.logic.OpenBalancesTask.doInBackground(OpenBalancesTask.java:44)
at javax.swing.SwingWorker$1.call(SwingWorker.java:295)
at java.util.concurrent.FutureTask.run(FutureTask.java:266)
at javax.swing.SwingWorker.run(SwingWorker.java:334)
at java.util.concurrent.ThreadPoolExecutor.runWorker(ThreadPoolExecutor.java:1142)
at java.util.concurrent.ThreadPoolExecutor$Worker.run(ThreadPoolExecutor.java:617)
at java.lang.Thread.run(Thread.java:745)
Caused by: java.lang.ArrayIndexOutOfBoundsException: 5
at com.strategyquant.plugin.Analyzer.impl.OpenBalances.logic.DataLoader.readData(DataLoader.java:54)
… 10 more
you might have selected an incorrect format during the data export, can you retry?
I am having same problem, there is only one way to export the csv file in meta trader 5. I tried both types of reports and no dice. Getting the same error, i tried to adjust the CSV file to exactly match. I also tried just exporting the duskacopy data directly from SQX and gives same error.
I think the problem is the formatting of the CSV from MT5. I think Quant analyzer wants the columns in a different way. and its causing the error. I have sent an email, reached out here and on the discord. Can someone please look into this.
Is Strategyquant ever going to do anything about this?
If QuantAnalyser does not recognise the .csv file exported from MT5, what is the use to us mostly using MT5?
And if QA does not see the equity curve of the trades and portfolio, then that is as close to useless as possible as you cannot see the live combined drawdown of the portfolio.
We expect to release an update soon (likely by the end of this year) with issues mentioned fixed.