Documentation
Applications
Last updated on 28. 9. 2015 by Mark Fric
Portfolio correlation explained
QuantAnalyzer has a new feature that can compute a correlation of strategies in the portfolio. This can be used in Analyze tab, or in Portfolio Master, where correlation settings can be used to filter out portfolios with too big correlation.
Here we’ll describe all the possible options of computing correlations.
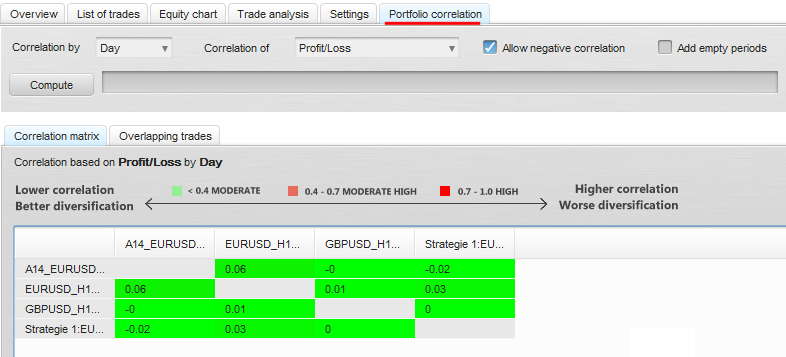
Correlation by (period)
is simply a choice of correlation period to consider. The most usual is correlation by day,it compares strategies by they day-to-day trades.
Correlation of (what)
is a choice what parameter of a strategy should be considered for correlation. The most usual choice is to compare strategies by daily Profit/Loss.
Options are:
- Profit/Loss – a sum of profit or loss for all the trades closed at a given period, for example day
- Number of closed positions – a number of positions that were closed in every period, it distinguishes between long and short trades, it adds +1 for long and -1 for short trade to the final count for the period.
- Number of closed trades – a number of trades that were closed in every period. It doesn’t consider whether the position is long or short, it counts both as a new trade.
- Number of open positions – a number of positions that were open in every period, it distinguishes between long and short trades, it adds +1 for long and -1 for short trade to the final count for the period.
- Number of open trades – a number of trades that were open in every period. It doesn’t consider whether the position is long or short, it counts both as a new trade.
All these formulas of correlation types are implemented as open source Snippets in QuantEditor -> CorrelationOf category, so you can easily add your own correlation value to compute.
Allow negative correlation
affects only the color in the table. If not allowed, it will consider too high negative correlations as “bad” showing the in the table with more red color.
Add empty periods
it can happen that there were no trades in a particular day (or other period) from both compared strategies. This option controls whether to add this day with 0 value to the list or if these days with zero values should be ignored when correlation is computed.
Correlation results
Computed results are shown in a table that shows correlation computed between every strategy in a portfolio.
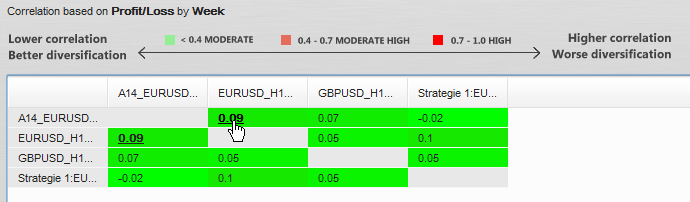
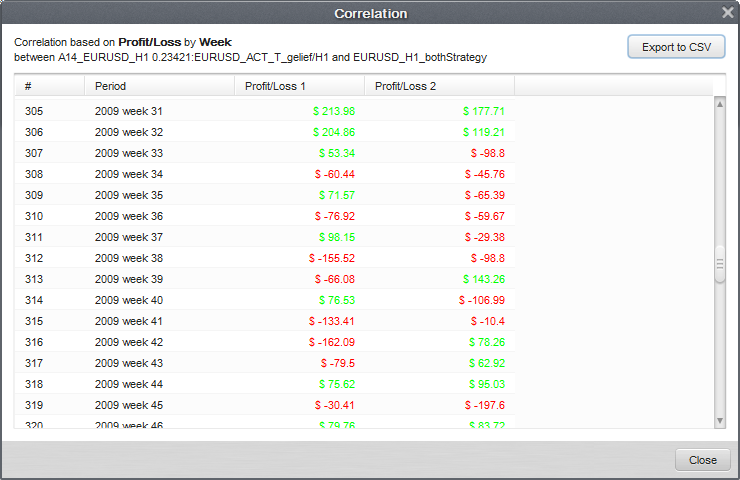
Every number in a table is clickable – you can open a dialogue, that shows you the number for each period that were used to compute the correlation, and you can export these numbers to CSV format:
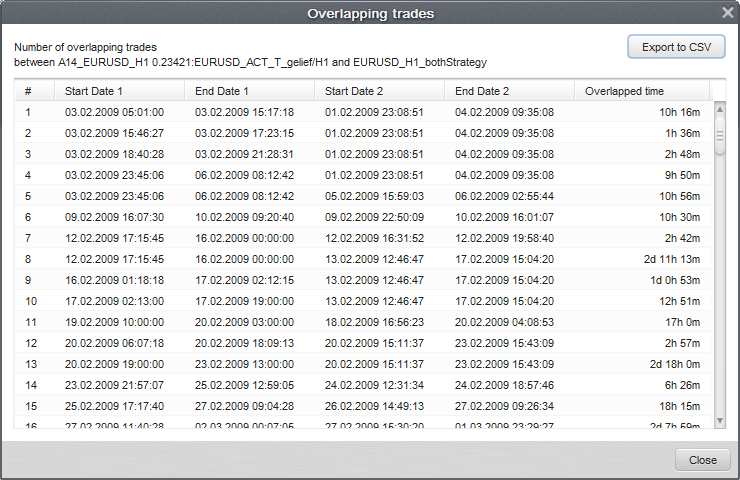
Another useful feature is Overlapping trades. Again, it is a table that shows how many trades were overlapped for each strategy in portfolio.
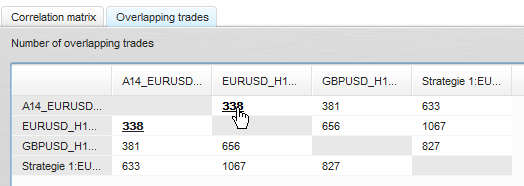
You can click on the number to see the detailed table of each overlapped trades case with open and close times, and total overlapped time.
Was this article helpful? The article was useful The article was not useful