Documentation
Applications
Last updated on 20. 7. 2015 by Mark Fric
Using History Trend
Page contents
History Trend is an simple feature that allows you to visually compare the performance of your strategy with the price behavior of the background asset.
In other words – it can tell you if the strategy performs well no matter if the market goes up or down.
History Trend feature is available as a icon on the Analyze -> Equity chart panel
![]()
Example 1 – Russel 2000 (TF) futures strategy
Let’s say you have a strategy like the one below that trades Russel 20000 index futures, the strategy has periods of ups and downs.
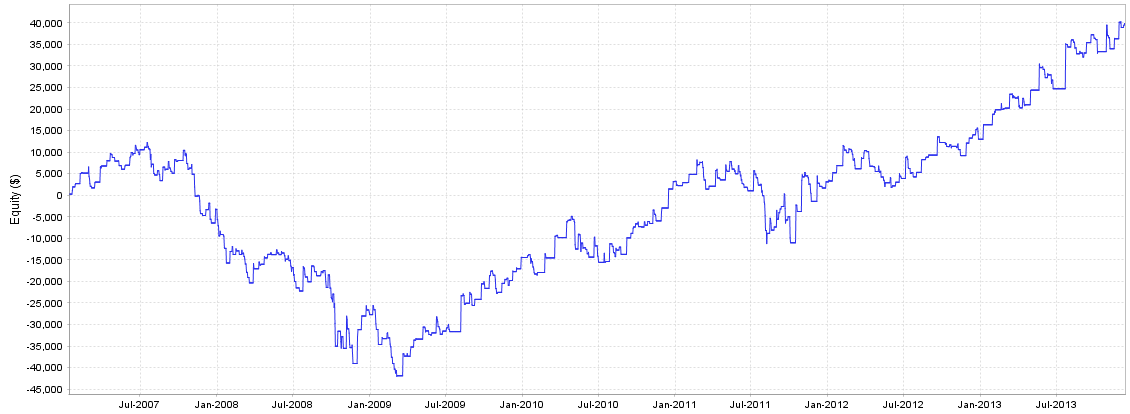
Let’s use History Trend to display the trend in the market during the time strategy was traded.
When we click on the History Trend icon it will allow us to configure the background chart:
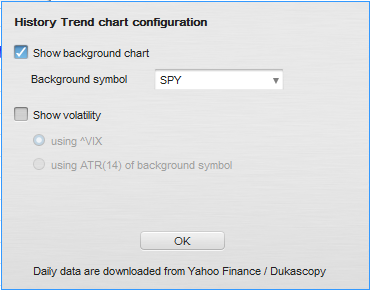
We can use it to draw chart of S&P 500 index on the background of equity curve to compare strategy performance with trend of the whole market.
All the non-forex data are downloaded from Yahoo Finance so you have to use the symbol that can be found there. In this example we used SPY as a symbol for SPDR S&P 500 ETF.
After clicking on OK the data are downloaded and the trend of S&P market is displayed on the background of the chart:

We can see that the strategy equity almost exactly matches the performance of the whole market. This means that the strategy will be losing when the market goes down and will be making money when the market goes up.
It is not exactly what we want – ideally we want a strategy that will make money on both bearish and bullish markets.
Example 2 – EURUSD strategy
Let’s try another strategy, this time from forex. This is its equity curve:
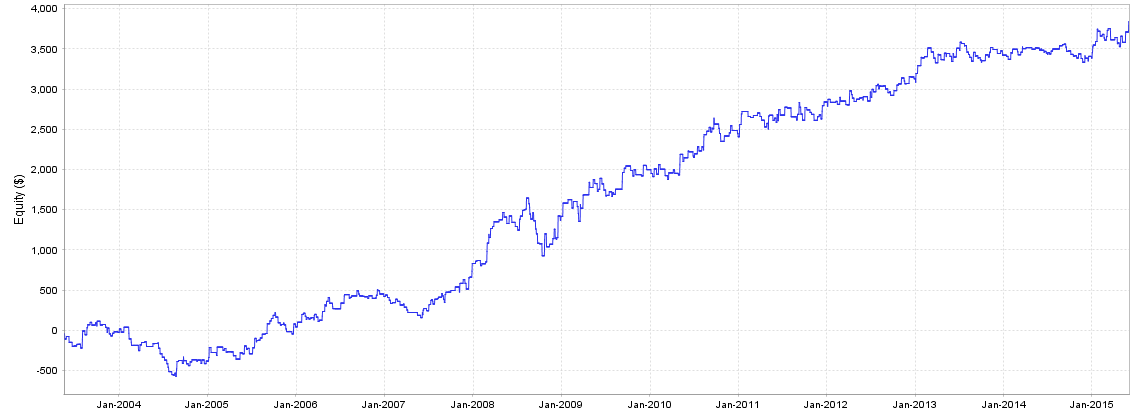
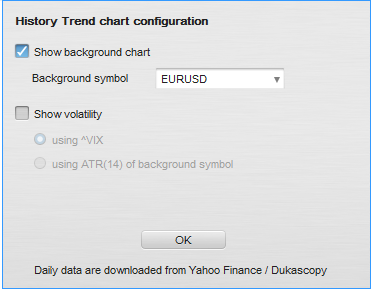
Now we can use History Trends to display movement of EURUSD currency:
Here is equity with daily EURUSD trend on the background:
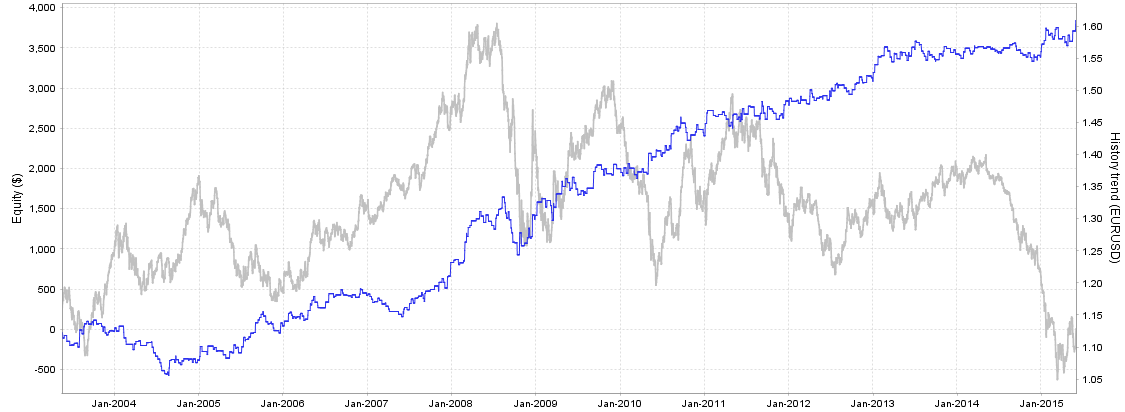
We can see that EURUSD fluctuates wildly, but the strategy makes money in almost every condition, doesn’t matter if EURUSD currency itself goes up or down.
Summary
To sum it up, History Trends is a simple, but useful tool that can reveal more information about your strategy performance.
Was this article helpful? The article was useful The article was not useful
The data from Yahoo finance always fails showing an URL error, is it possible to replace the external source of data for the M1 data imported for the open balances calculation?
I am trying also to import a graph fromYahoo Finance but is not working.
I am trying to import the Brazilian Index Market, called “IBOV”.
Could you help me??
Do you have a data file for IBOV? You can send to support@Kevin.com we will check