


 英語
 スペイン語
 ポルトガル語
 フランス語
 イタリア語
 ドイツ語
ドキュメント
アプリケーション
最終更新日:2020年5月22日、マーク・フリックによって
結果と戦略の相関
tab Portfolio correlation is visible only if the strategy backtest contains multiple results:
- you used Merge function (in databank) to merge multipe strategies to a portfolio
- you use 追加の市場でのバックテスト cross check to test the strategy on more markets
The correlation matrix has to be computed, you can choose correlation by hour, day, week or month and correlation of Profit/Loss or trade counts.

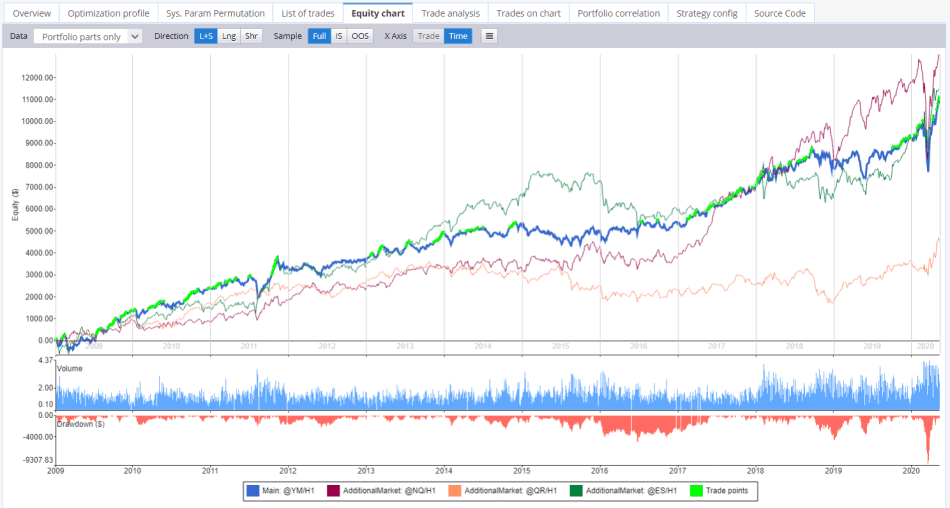
When you have multiple strategy backtest merged in one strategy, you can also see equity curves for all of them in Equity chart:
この記事は参考になりましたか? この記事は役に立った この記事は役に立たなかった
コメントを投稿するにはログインしてください
0 コメント
最古の