


 英語
英語 スペイン語
スペイン語 ポルトガル語
 フランス語
フランス語 イタリア語
イタリア語 ドイツ語
ドイツ語ドキュメント
アプリケーション
最終更新日:2026年4月15日(Kornel Mazur)
「Volume Pro」ファイル
ページのコンテンツ
「Volume Pro」ファイル
「Volume Profile」は、価格水準ごとの出来高分布を示しています。
従来の出来高指標は、ローソク足やバー単位など、特定の期間における総出来高を表示します。「Volume Profile」は、時間ではなく価格ごとに出来高を分類することで、この制限を解消しています。.
これにより、トレーダーは各価格帯でどれだけの出来高が取引されたかを確認でき、市場活動の真の構造が明らかになります。.
価格ベースの出来高配分のメリット:
- 活発な取引が行われている価格帯を特定する
- 買い手と売り手の価値観が一致する場所を示す
- 流動性が集中しているエリアをハイライトする
- 1TP9は、市場での受け入れや拒絶に関する洞察を提供します
この情報は、単の時間間隔あたりの総出来高を観察するよりも、市場の動向を理解する上ではるかに有用です。.
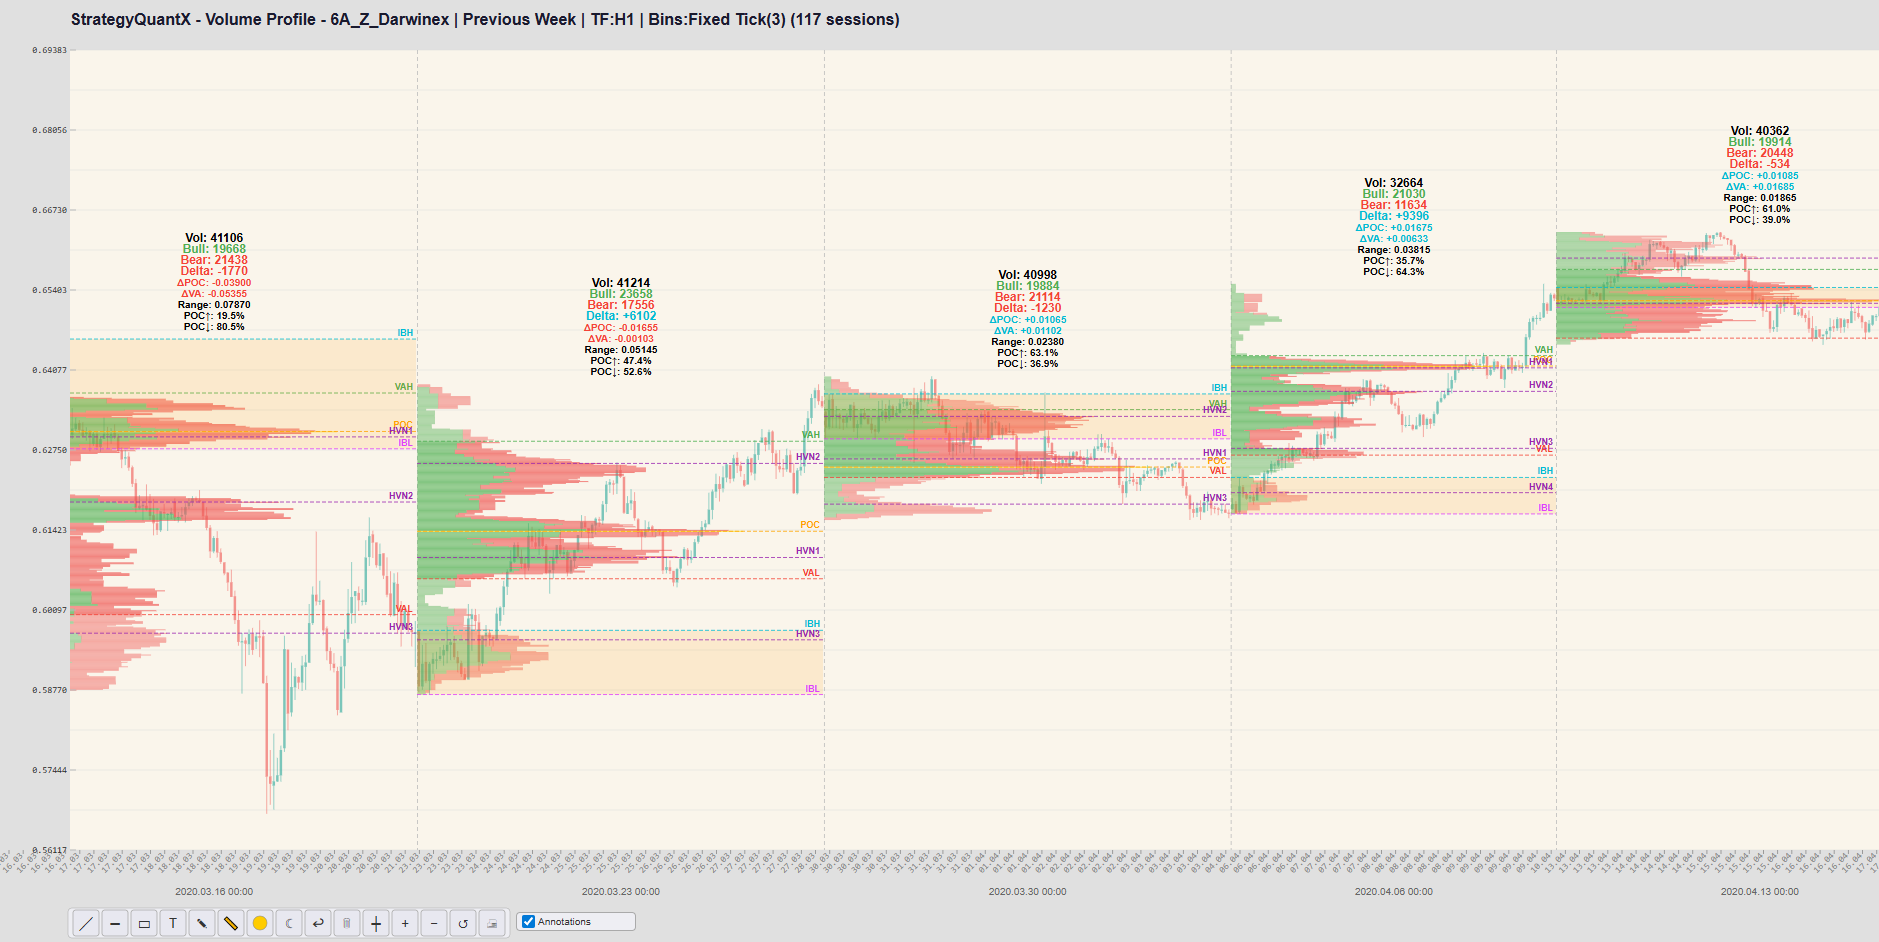


主要な市場基準水準の特定
Volume Profileは、プロのトレーダーの間で広く利用されている重要な構造的水準を生成します。.
主な水準には以下が含まれます:
- コントロールポイント
選択されたセッション中に最も多くの出来高が取引された価格水準。.
- バリューエリアハイ
取引高が約70%を占める値域の上限。.
- バリューエリア・ロー
バリューエリアの下限.
これらの水準は、市場が過去に価値に合意した領域を表しているため、自然なサポートゾーンやレジスタンスゾーンのように機能することがよくあります。.
実務上の影響:
- 価格はしばしばPOC(コントロールポイント)に戻回する傾向がある
- VAHとVALは、ブレイクアウトや反転のレベルとして頻繁に機能します
- 機関投資家は、多くの場合、これらの領域の周辺でポジションを執行します。
これらの水準は、多くの従来の指標とは異なり、客観的な市場構造を提供します。.
高・低出来高ノードの検出
Volume Profile では、高ボリュームノード(HVN)と低ボリュームノード(LVN)が強調表示されています。.
- 高出来高ノード
これらは大量の取引が行われた価格帯を表しています。.
解釈
- 市場はこれらの価格を受け入れた
- その領域は適正価値を表しています
- 価格はこれらのゾーン付近で保ち合いになる傾向がある
- 低出来高ノード
これらは取引がほとんど行われなかった価格帯を表しています。.
解釈
- 市場はこの価格を受け入れなかった
- これらのゾーンは、多くの場合、動きの速いエリアとして機能します。
- 価格はLVN(低出来高ノード)を急速に通過する傾向がある
これは、単純な出来高のバーでは示すことのでえない、市場のオークションプロセスに対する洞察を提供する。.
より信頼性の高いサポートおよびレジスタンスレベル
多くのテクニカル指標は、数理公式や価格パターンを用いて支持線と抵抗線を推定しようと試みます。.
代わりに「Volume Profile」 実際の取引活動に基づいてサポートとレジスタンスを特定します。.
これらの水準は、次の領域を表しているため、より信頼性が高い:
- 多額の資本が取引された
- 機関投資家が活発に取引していた
- 市場は以前均衡点に達していた
その結果、Volume Profile のレベルでは、しばしば 従来のインジケーターのレベルよりも意味のある反応。.
機関投資家の動きの検知精度の向上
Large institutions typically execute orders at specific price levels where liquidity is available.
Because Volume Profile highlights areas where significant trading activity occurred, it can reveal zones where institutional participation was likely present.
Examples include:
- accumulation zones
- distribution zones
- absorption areas
These areas often influence future market behavior and can become important reference levels for future trading decisions.
高度な取引手法との互換性
Volume Profile integrates well with other advanced trading tools such as:
- VWAP (Volume Weighted Average Price)
- Market Profile (TPO)
- Order flow analysis
- Footprint charts
- Delta volume analysis
By combining these tools, traders can obtain a more complete understanding of market structure, liquidity, and order flow.
アルゴリズムおよびクオンツ戦略に適しています
Volume Profile can be used to generate systematic trading signals.
Examples include:
- POC breakout strategies
- Value area rotation strategies
- Reversion to POC strategies
- Low-volume node breakout strategies
- Initial balance breakout strategies
Because Volume Profile generates objective levels based on traded volume, these signals can often be implemented effectively in automated trading systems.
まとめ
Traditional volume indicators show how much trading occurred during a specific period of time.
Volume Profile provides deeper insight by showing where trading occurred in terms of price levels.
This difference allows traders to:
- identify fair value zones
- detect market structure
- locate liquidity concentrations
- observe institutional activity
- build more robust trading strategies
As a result, Volume Profile provides a more comprehensive view of market dynamics than simple volume indicators.
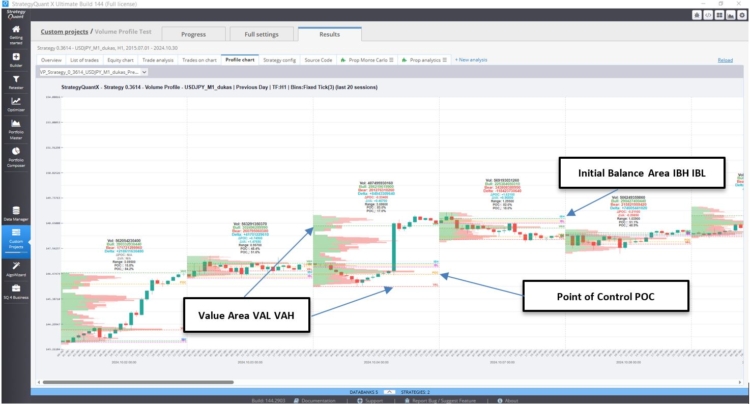
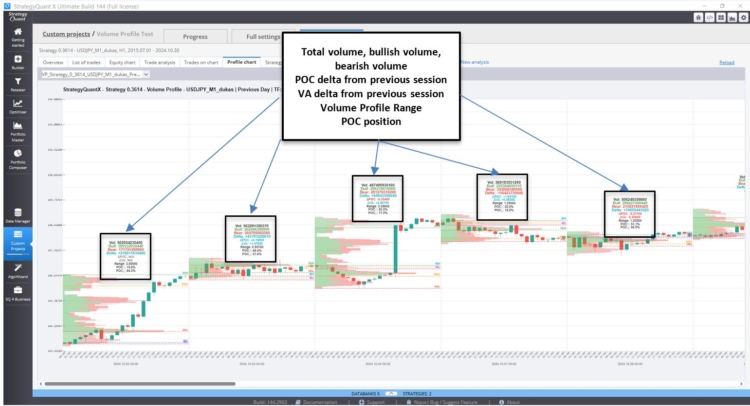
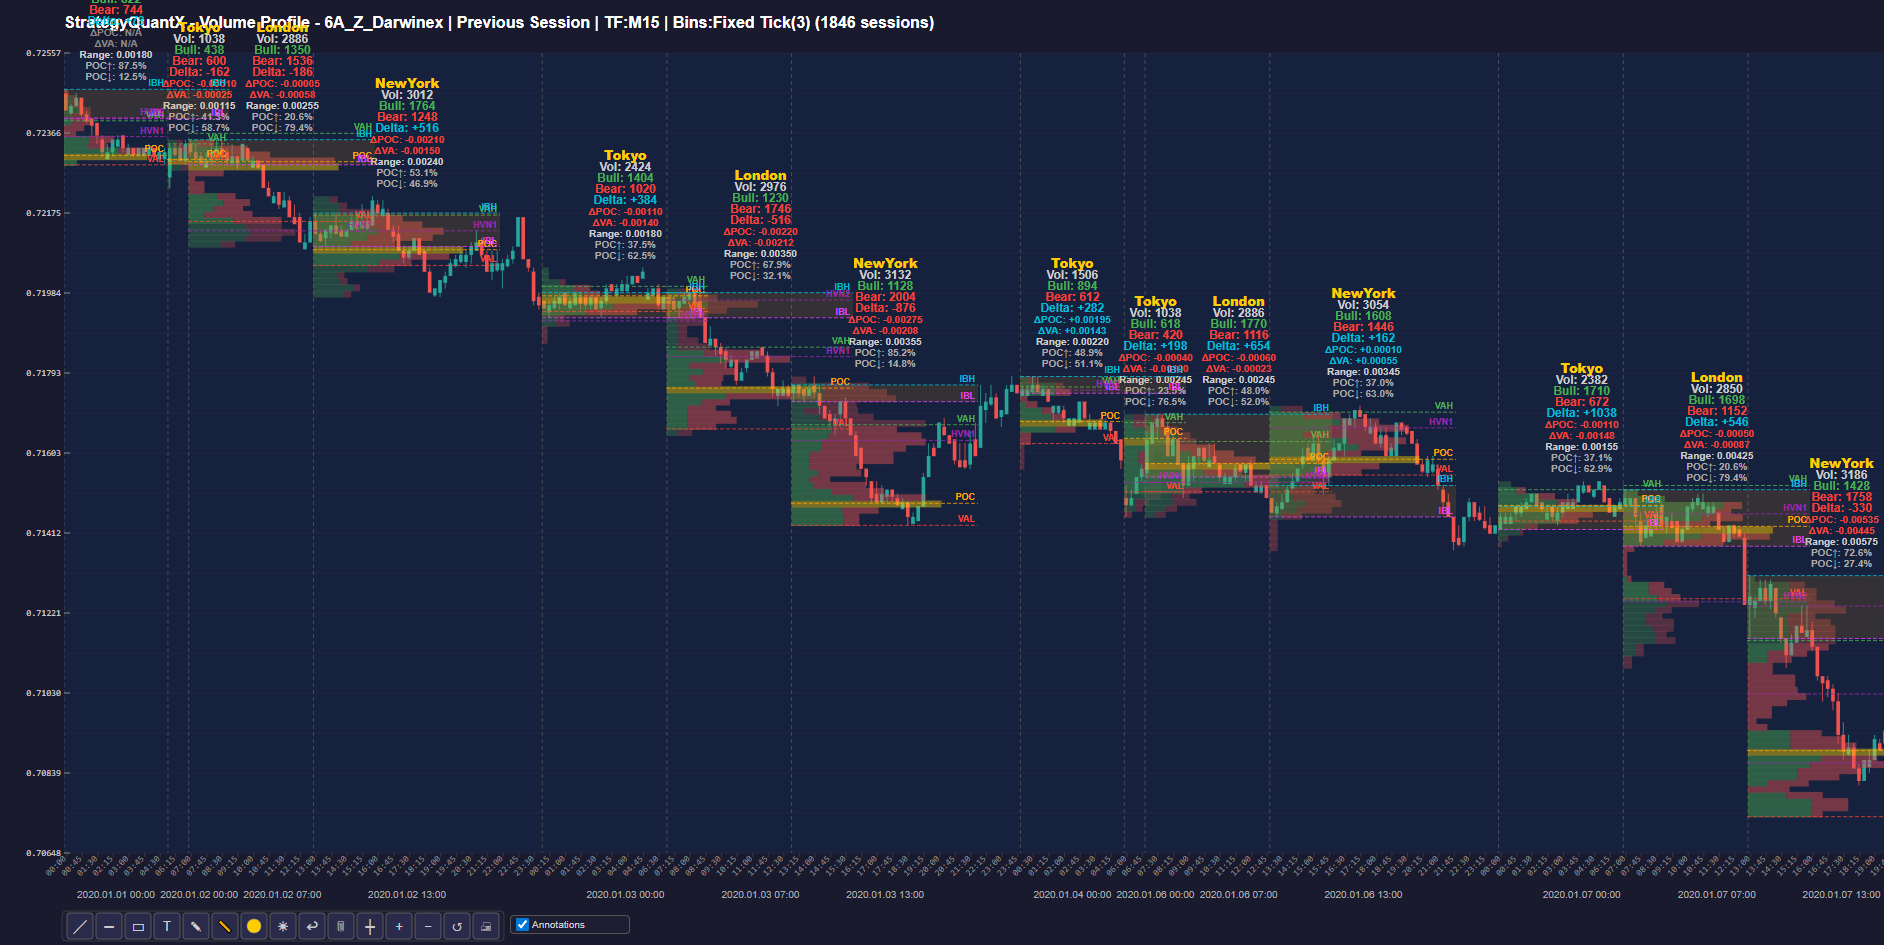
I. StrategyQuantX ボリュームプロファイルチャート


II. ボリュームプロファイルのパラメータ
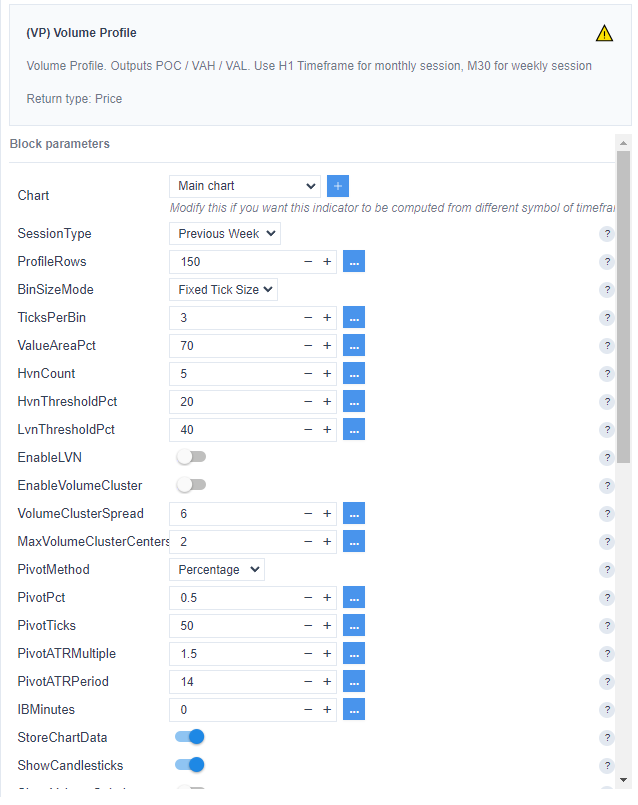
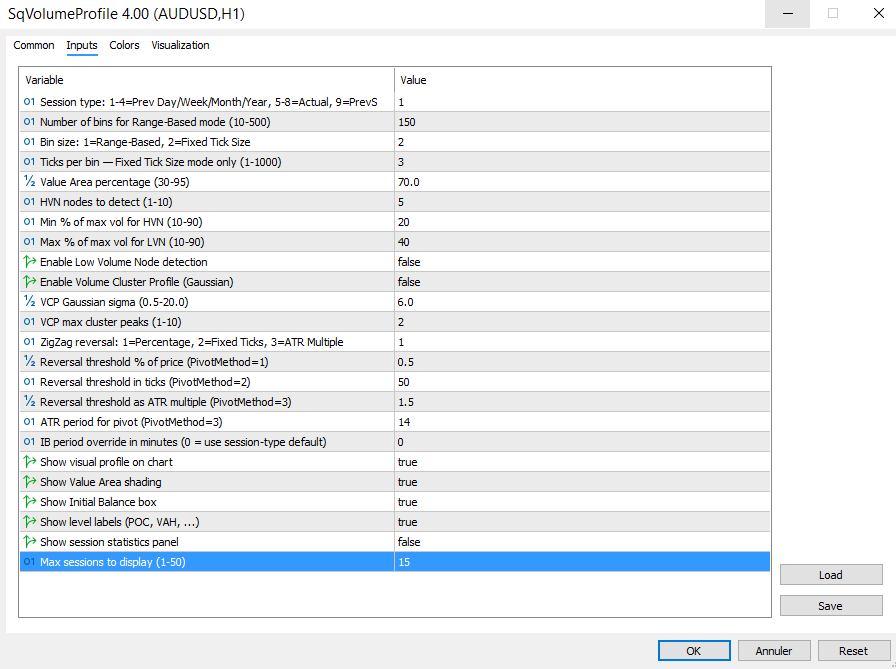
1/ StrategyQuantでVolume Profileを設定するには、まずセッションタイプを選択します。.
- Previous Daily Session
- Previous Weekly Session
- Previous Monthly Session
- Previous Yearly Session
セッションの種類に応じて、適切な時間枠が選択されます。.
- M15 for Daily
- H1 for weekly
- H4 Monthly
3/ 一貫性のあるバックテスト結果を得るために、BinSizeModeは「Fixed Tick Size」に設定することをお勧めします。“
4/ TicksPerBin.
Depending on the selected session, the range of the Volume Profile can vary. For a daily session, the range is typically smaller, while for a monthly session it can be significantly larger.
For example, in a daily session the bin size may be 3 ticks per bin, meaning each level of the Volume Profile represents 3 ticks.
In a monthly session, the bin size may increase to 30 ticks per bin, meaning each level of the Volume Profile represents 30 ticks.
The parameters HVN Count, HVN Threshold, 、および LVN Threshold define how 高出来高ノード そして 低出来高ノード are detected in the Volume Profile. The default values usually do not require adjustment.
その EnableLVN parameter allows you to enable the detection of 低出来高ノード.


III. ボリューム Proファイルの詳細パラメータ
1/ ボリュームクラスタ Profile (VCP)
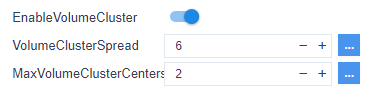
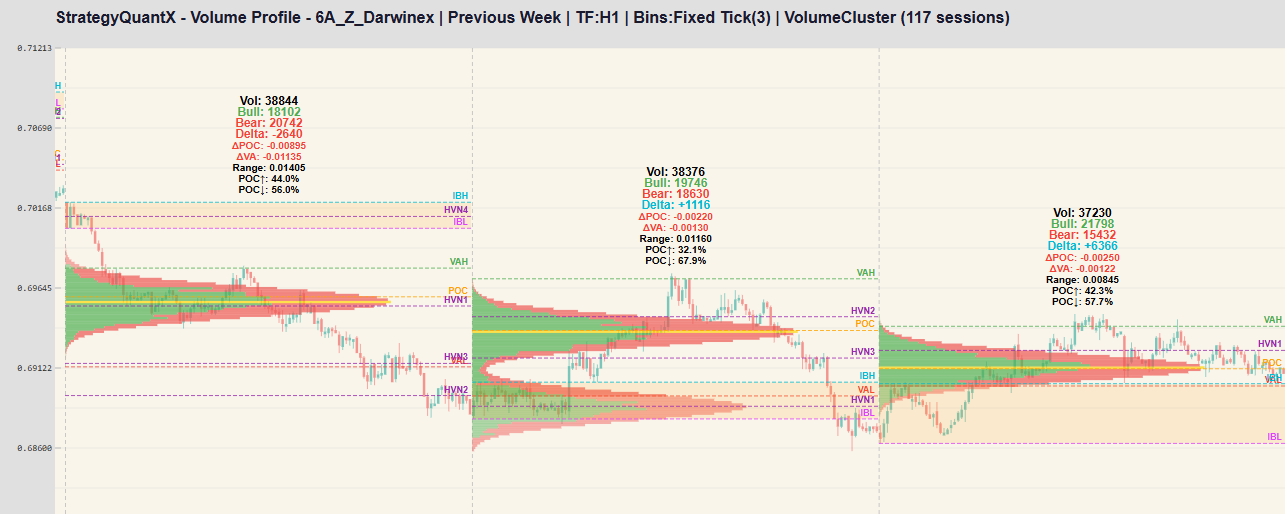
Volume Cluster Profile (VCP) is an advanced Volume Profile indicator that analyzes volume distribution by price and highlights the most important volume clusters within a trading range. Instead of displaying only a raw histogram, the indicator detects the dominant volume peaks (clusters) and smooths them using a Gaussian distribution, which spreads the influence of each cluster across nearby price levels to better reveal meaningful liquidity zones. It can build profiles for the current chart window or for previous swing segments, and it records historical profiles between pivot points.
We can set the Maximum Cluster Center : 2 or more
As shown below, the instrument tends to return to the previous cluster (HVN1).


2/ スウィング・セッション
The Swing Profile combines a Zig-Zag trend detector with a Volume Profile analysis. Instead of calculating one profile for a fixed time range, the indicator creates a separate volume profile for each price swing identified by the Swing, allowing traders to analyze how volume is distributed within individual market trends.
The idea of building a Volume Profile for each market swing is particularly interesting because it aligns the analysis with the natural structure of the market rather than with fixed time periods such as sessions or days. By using a Zig-Zag algorithm to detect market reversals, a new Volume Profile can be generated for each trend segment. This allows traders to analyze how volume is distributed within a specific directional move, revealing where buyers or sellers were most active during that swing.
When price later revisits these levels, they often act as support or resistance because they correspond to areas where significant trading previously occurred. This approach is especially useful in algorithmic trading because it captures the volume structure of each market leg, helping identify accumulation zones, trend strength, and potential reversal areas more effectively than traditional session-based volume profiles.
In practice, this approach helps traders understand volume distribution inside each trend segment, detect buy/sell imbalances, and identify support and resistance levels created during market swings.
A new swing is detected based on one of the following methods: Pivot Percentage, Fixed Ticks, or a multiple of the ATR.
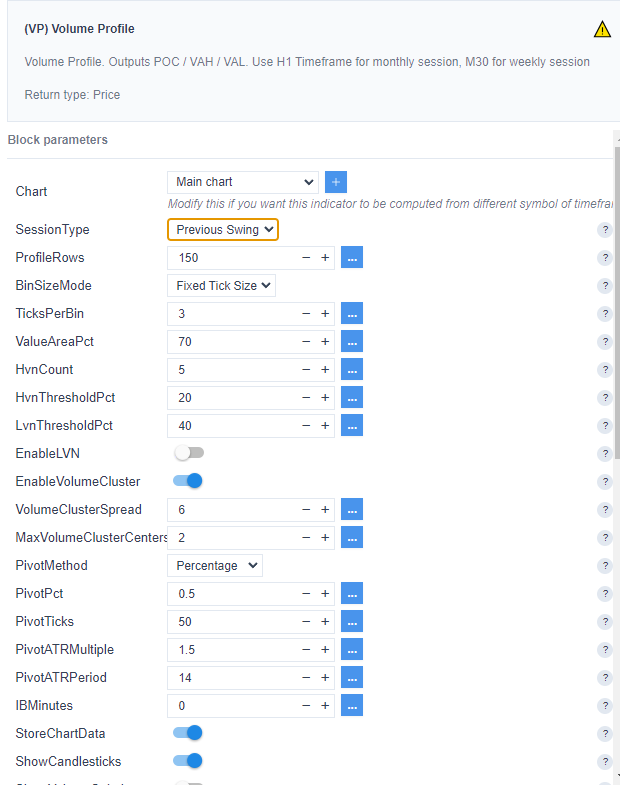


Depending on the instrument, it may be necessary to adjust both the timeframe and the pivot parameters.
のための currency futures instruments, a 10-minute timeframe (M10) can be used.
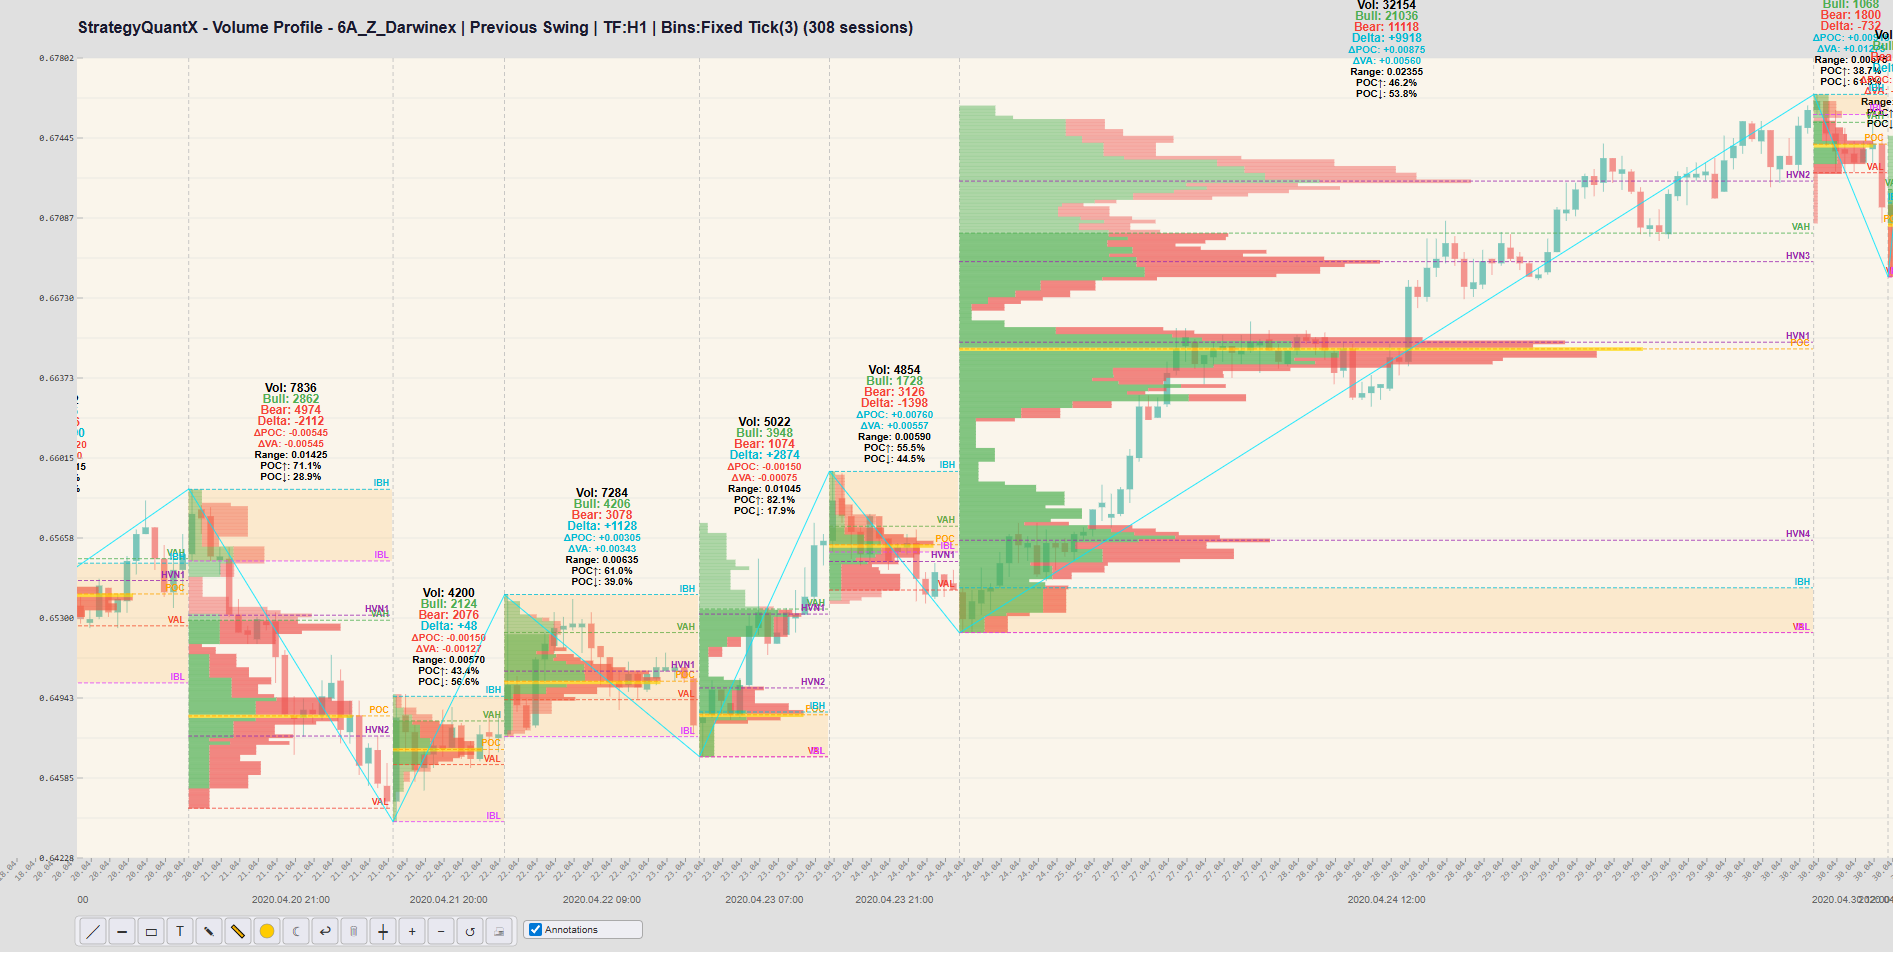
– ShowZigZagLine
This option allows you to view the swing with swing session only


3/ イニシャル・バランス
その Initial Balance is automatically set by default to 0.
The default periods are:
- Daily session: 60 minutes
- Weekly session: 720 minutes (12 hours)
- Monthly session: 1440 minutes (24 hours)
- Yearly session: 8640 minutes (6 days)
- Swing session: 60 minutes
You can adjust these parameters by setting the desired number of minutes.
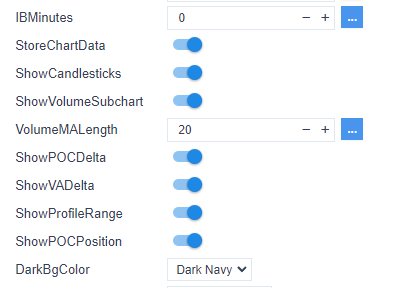
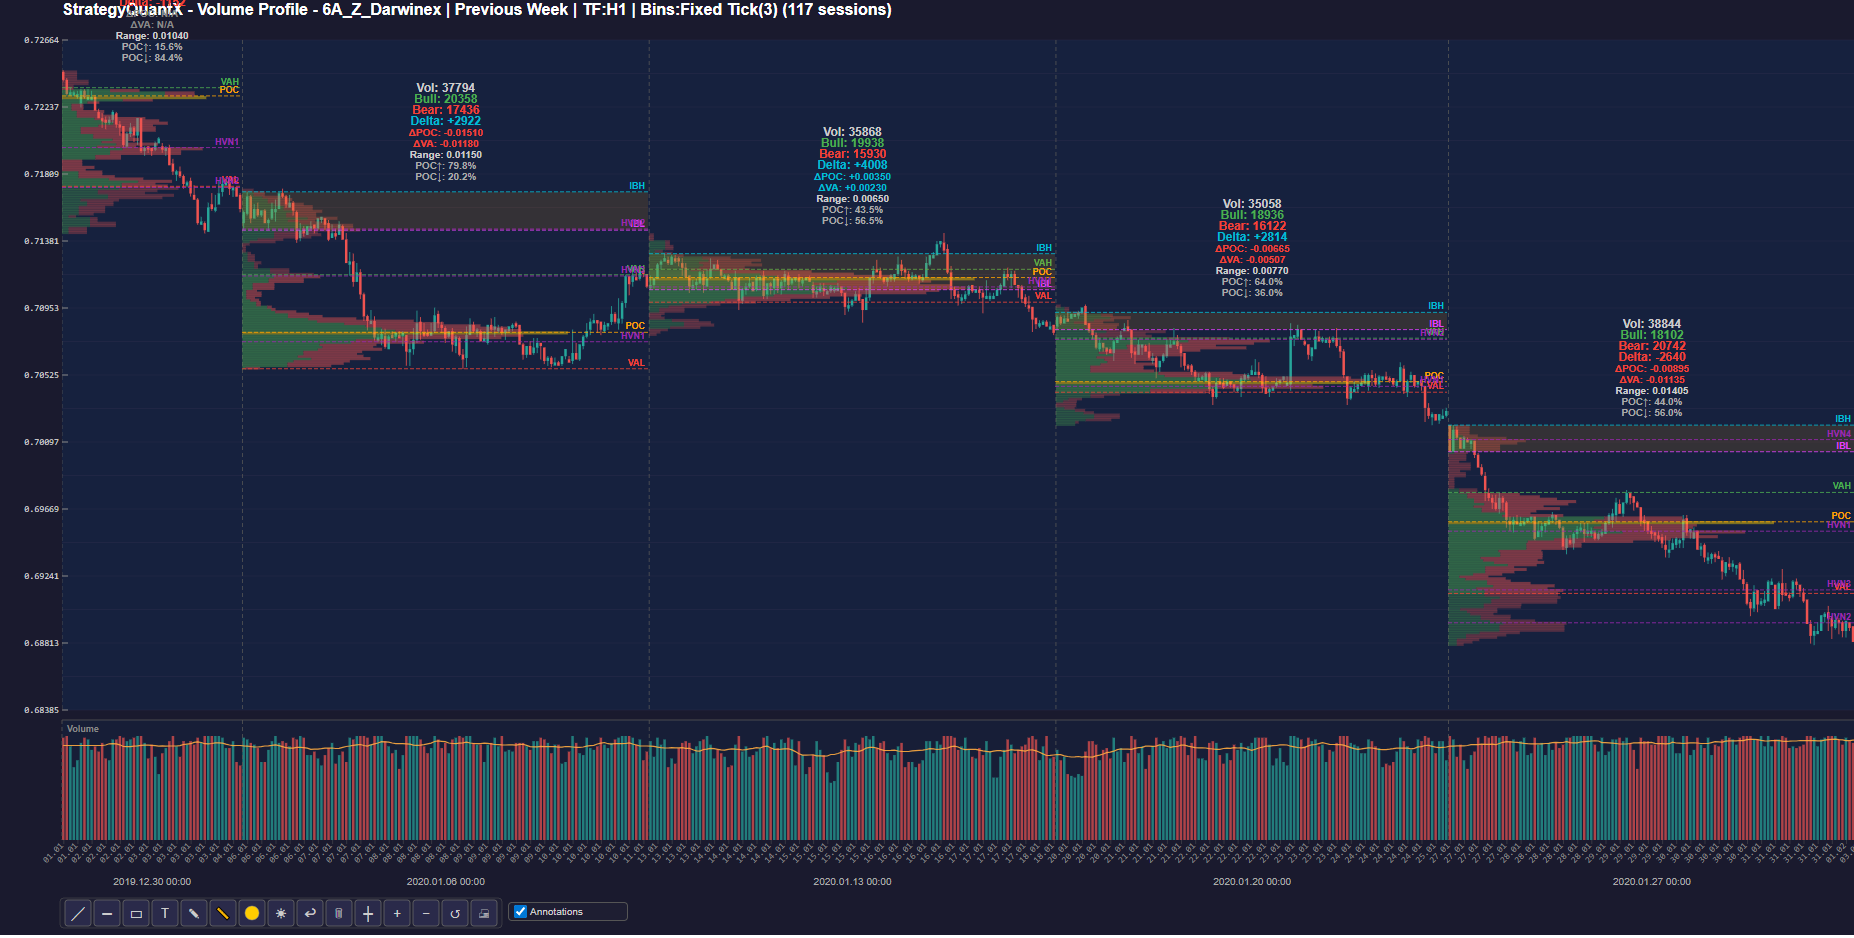
4/ チャートデータを保存する
This option allows you to view the Volume Profile.
ローソク足を表示
This option allows you to view the candle sticks with the volume profile
6/ ボリュームサブチャートを表示
This option allows you to view the volume
7. カスタム時間ボリューム Proファイル
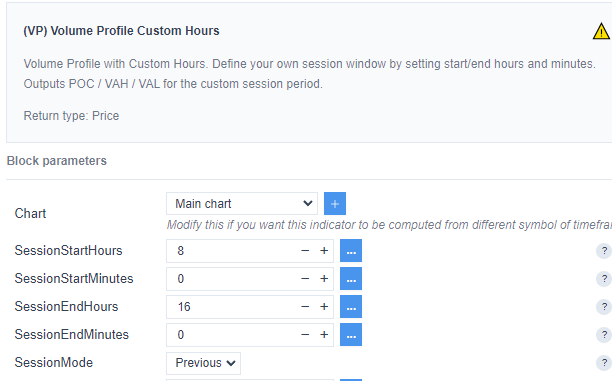
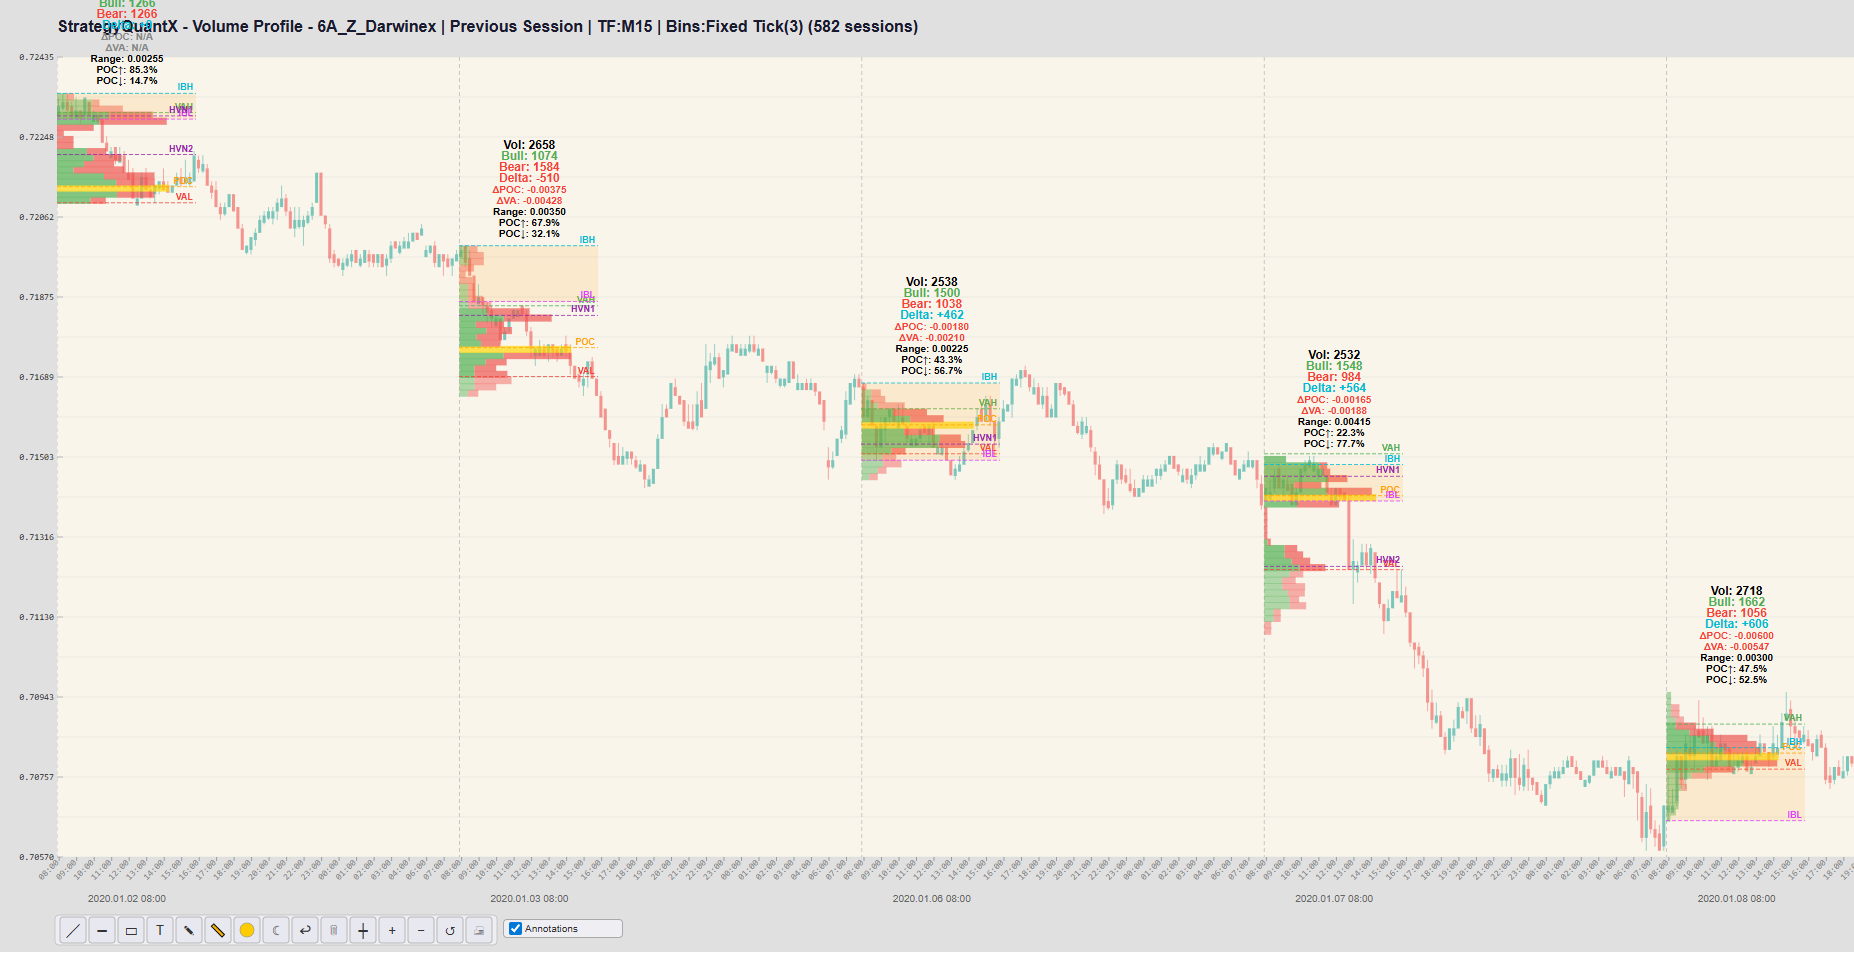
A Custom Hour Volume Profile allows traders to analyze the volume distribution during a specific hour of the trading session, providing a more focused view of market activity.
Instead of studying the entire session, traders can concentrate on a precise time window and observe how price and volume behave during that period. This approach helps identify important price levels such as the コントロールポイント, バリューエリアハイ, 、および バリューエリア・ロー for that specific hour.
By isolating individual hours, traders can better understand when the highest trading activity occurs and how liquidity evolves throughout the session.
It also allows them to focus on hours that historically produce stronger price movements, improving the timing of trade entries and exits. In addition, this type of analysis makes it easier to compare market behavior between different trading periods, such as the London open and the New York open.
Custom Hour Volume Profile helps traders isolate and analyze the most relevant time periods of the trading day, leading to a clearer understanding of market dynamics and more informed trading decisions.

8. マルチセッション・ボリューム Proファイル
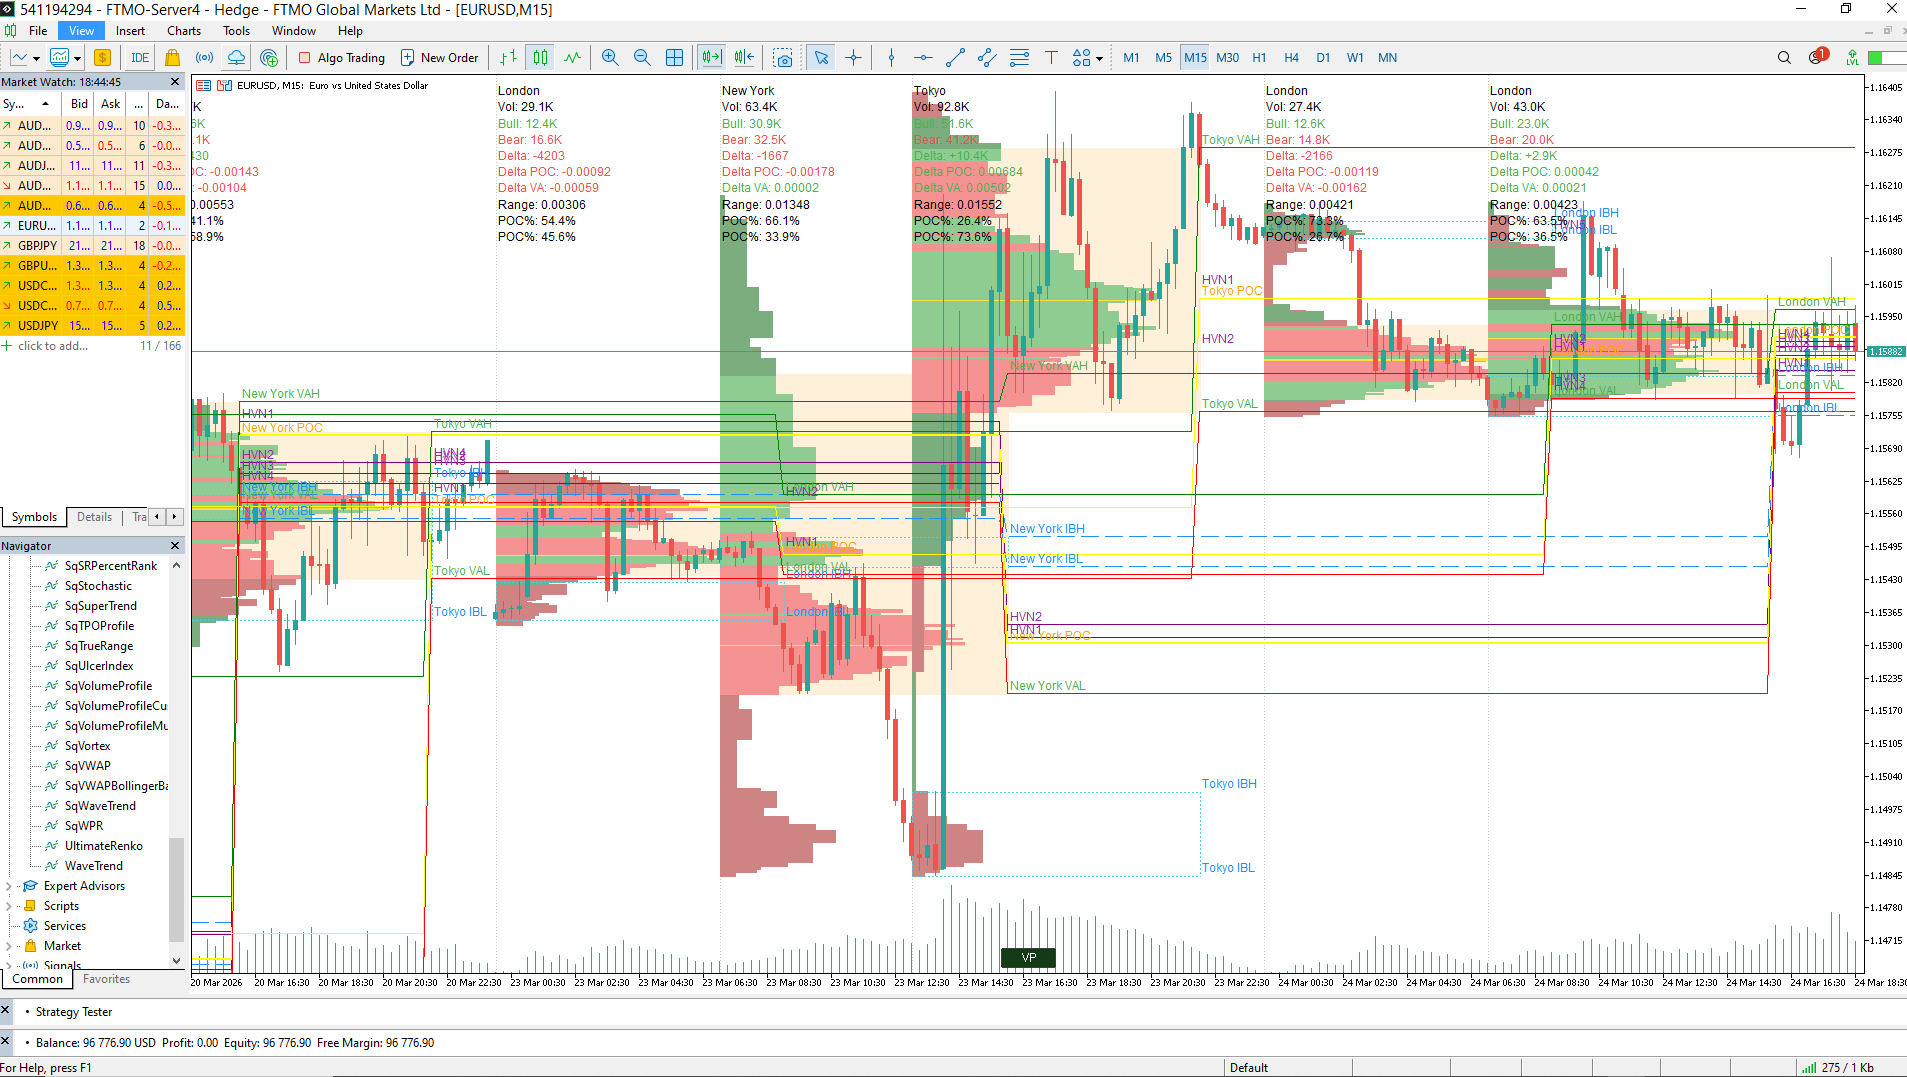
This option displays Volume Profiles for multiple trading sessions (Tokyo, London, New York), allowing you to analyze the evolution of the instrument across different market time zones.
A Multi-Session Volume Profile allows traders to analyze how volume and liquidity evolve across different trading sessions such as Tokyo, London, and New York. By separating the profiles for each session, it becomes easier to identify where major market participants were active, detect session-specific support and resistance levels, and observe how price reacts when entering a new session. This helps traders better understand global market dynamics and the influence of each trading center on price movement.
IV. MetaTrader Volume Proファイル
1. 第1巻TP9Tファイル

In MetaTrader, the display of Volume Profile statistics is controlled by the ‘Show Session Statistics Panel’ parameter.
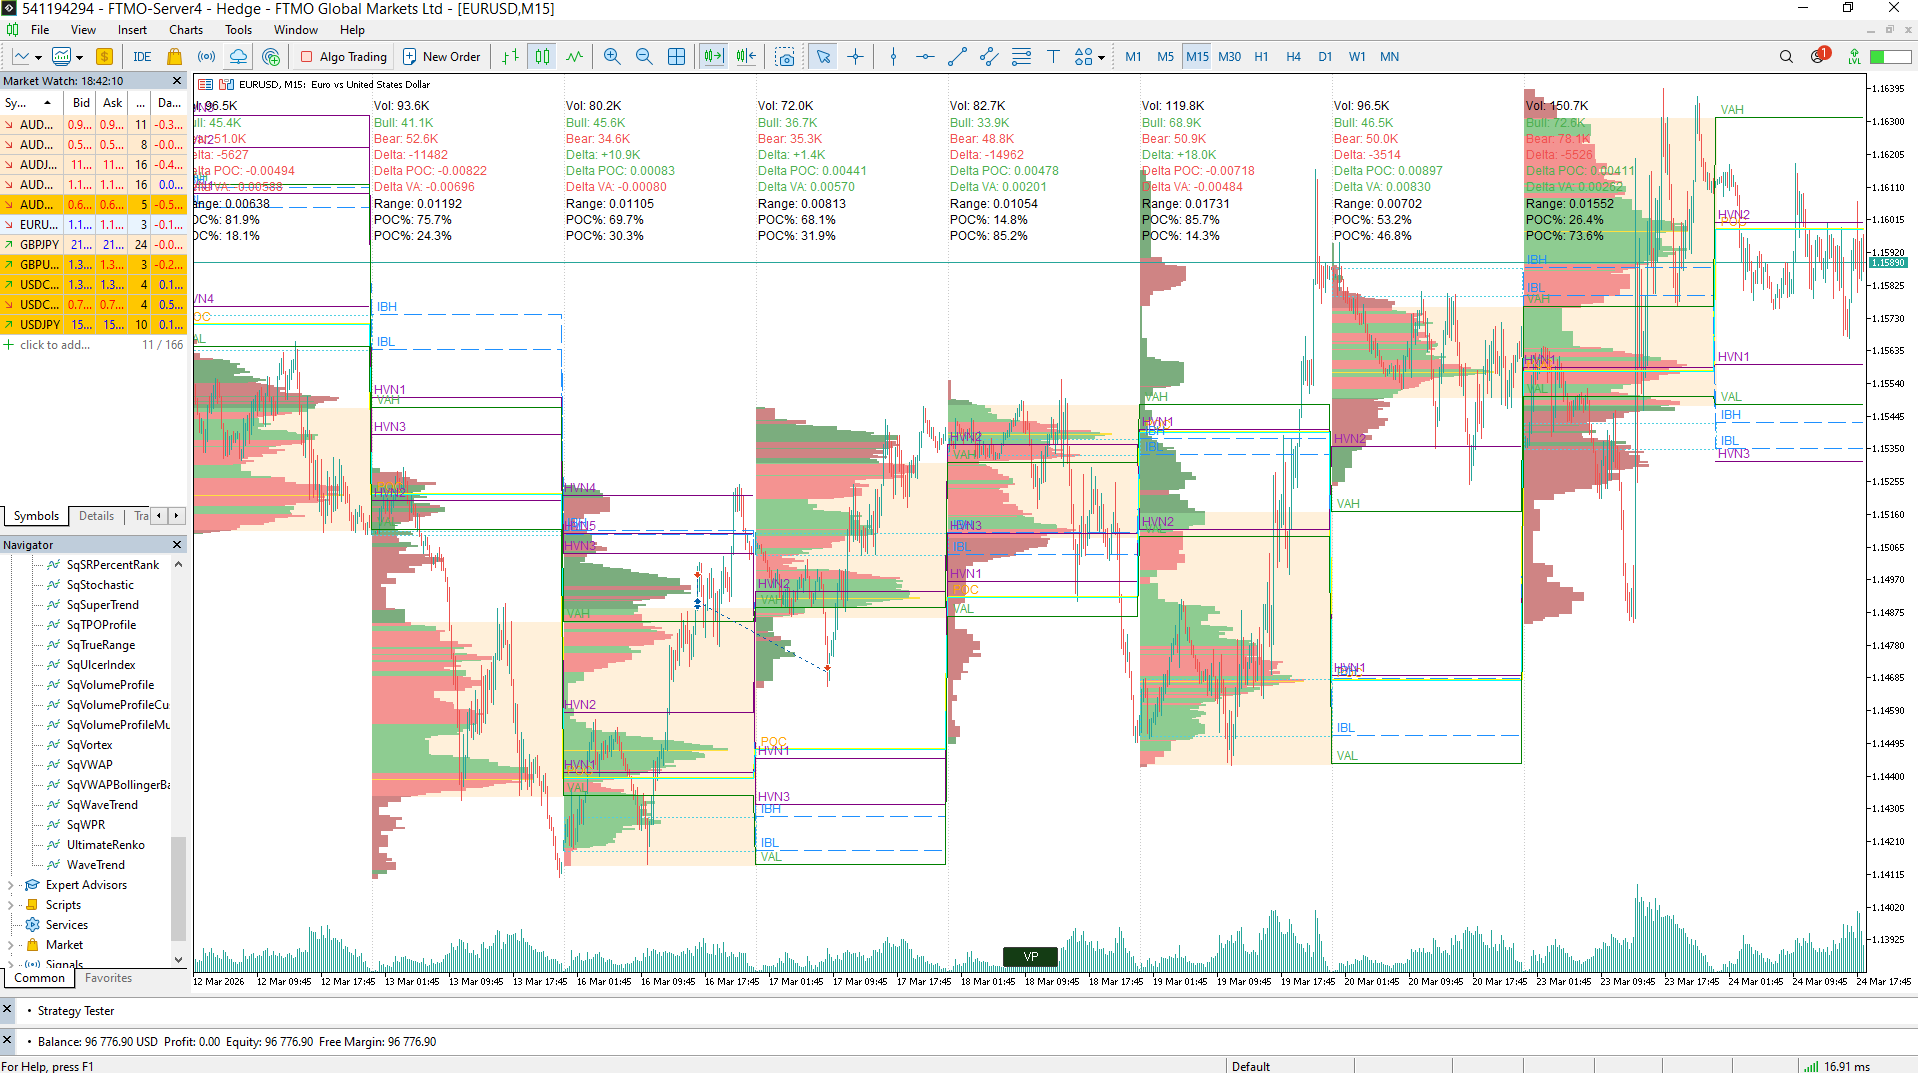

To activate the Volume Profile view, click the VP button at the bottom center of the screen.
By default, the MetaTrader Volume Profile is disabled to maintain the indicator’s performance.
You can select the number of sessions to display using the ‘Max Sessions to Display’ setting.
The Volume Profile indicator values remain available even when the view is disabled.
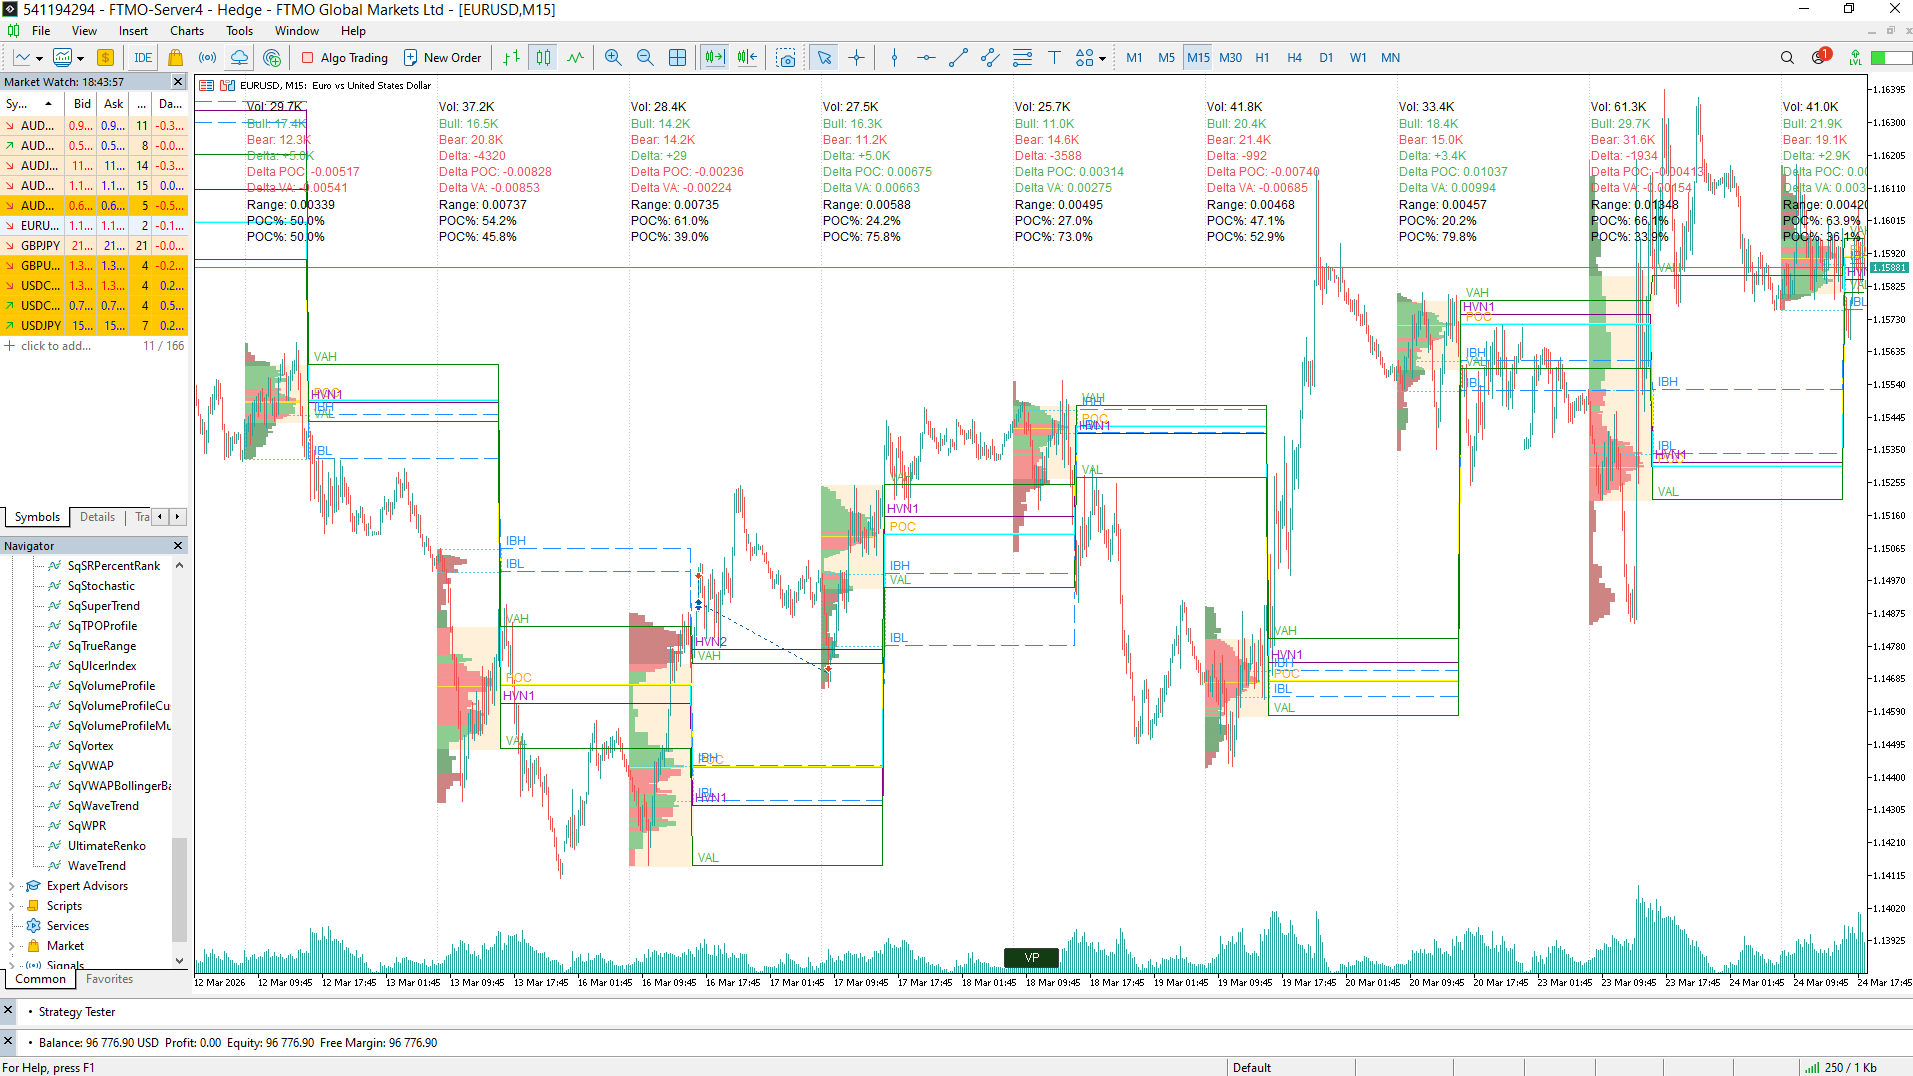
2. 第1巻 TP9Tファイル カスタム時間
The Volume Profile Custom Hour allows users to analyze the Volume Profile for a specific session.
For improved accuracy, a smaller time frame is recommended like M15
3. 第1巻 TP9Tファイル マルチセッション
This option displays Volume Profiles for multiple trading sessions (Tokyo, London, New York), allowing you to analyze the evolution of the instrument across different market time zones in Metatrader.
4. クラスタモードでのVolume Proファイル
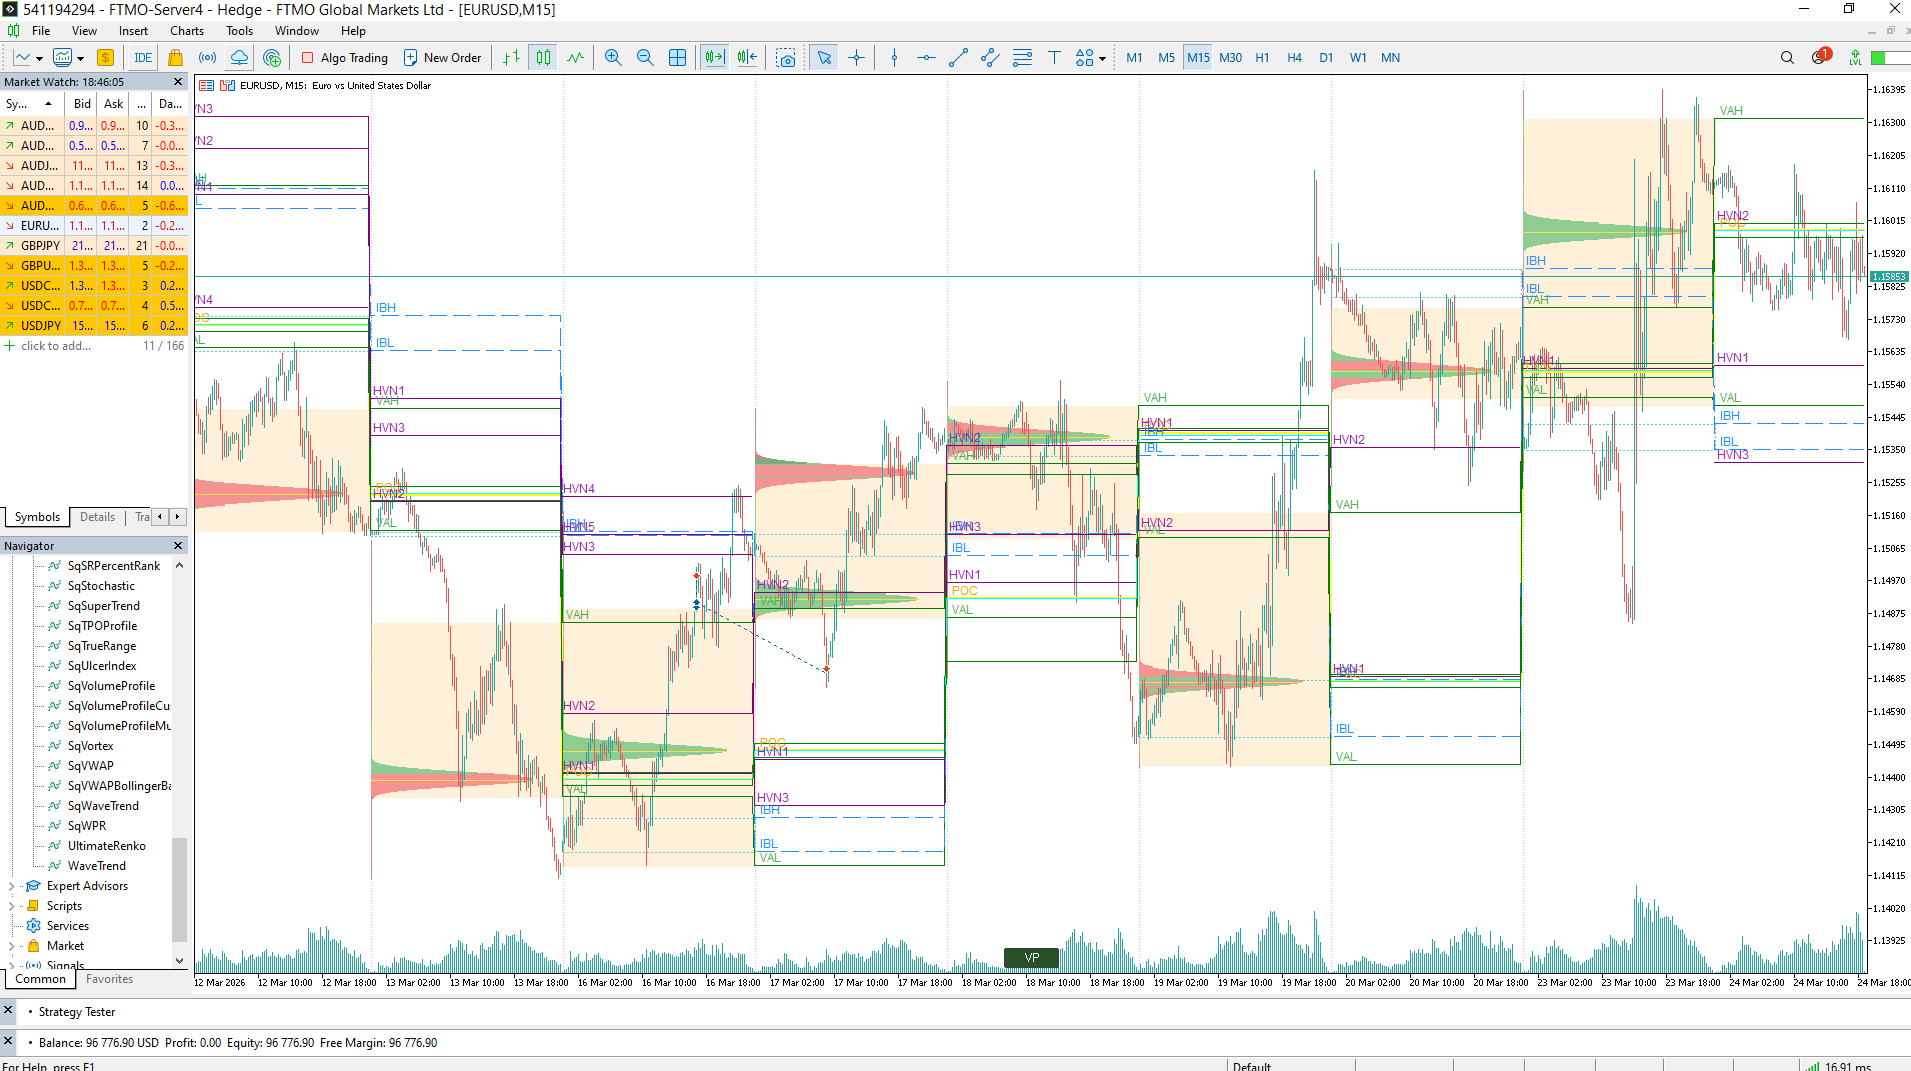
The Volume Cluster Profile (VCP) is a Volume Profile indicator that analyzes volume distribution by price in MetaTrader.
You can select the number of peaks per session using the “VCP Max Cluster Peaks” parameter and adjust the indicator using “VCP Gaussian Sigma.”
In general, the larger the session (daily, weekly, monthly), the greater the number of peaks.

SQXに取り込む方法
Volume Profile および Market Profile は、StrategyQuant X Ultimate ライセンスに含まれています。 ProfessionalおよびStarterのユーザーは、アドオンプラグインとして全機能を利用できるようになるため、現在のプランのままでもこれらの機能にアクセスできます。.
この機能、無期限のサポートアップデート、プレミアムデータ、その他のプレミアム機能を利用する: SQX Professional から Ultimate へのアップグレード
12回払い | 一括払い
StarterおよびProfessional用の「Market & Volume Profile」アドオン(別売)
月額サブスクリプション | 年間サブスクリプション
Additional resources
https://www.tradingview.com/script/lDxohpMZ-Volume-Cluster-Profile-VCP-Zeiierman/
https://www.tradingview.com/script/L2LxYayS-Zig-Zag-Volume-Profile-Bull-vs-Bear-Kioseff-Trading/
この記事は参考になりましたか? この記事は役に立った この記事は役に立たなかった