Documentation
Applications
Last updated on 15. 4. 2026 by Kornel Mazur
The Volume Profile
Page contents
The Volume Profile
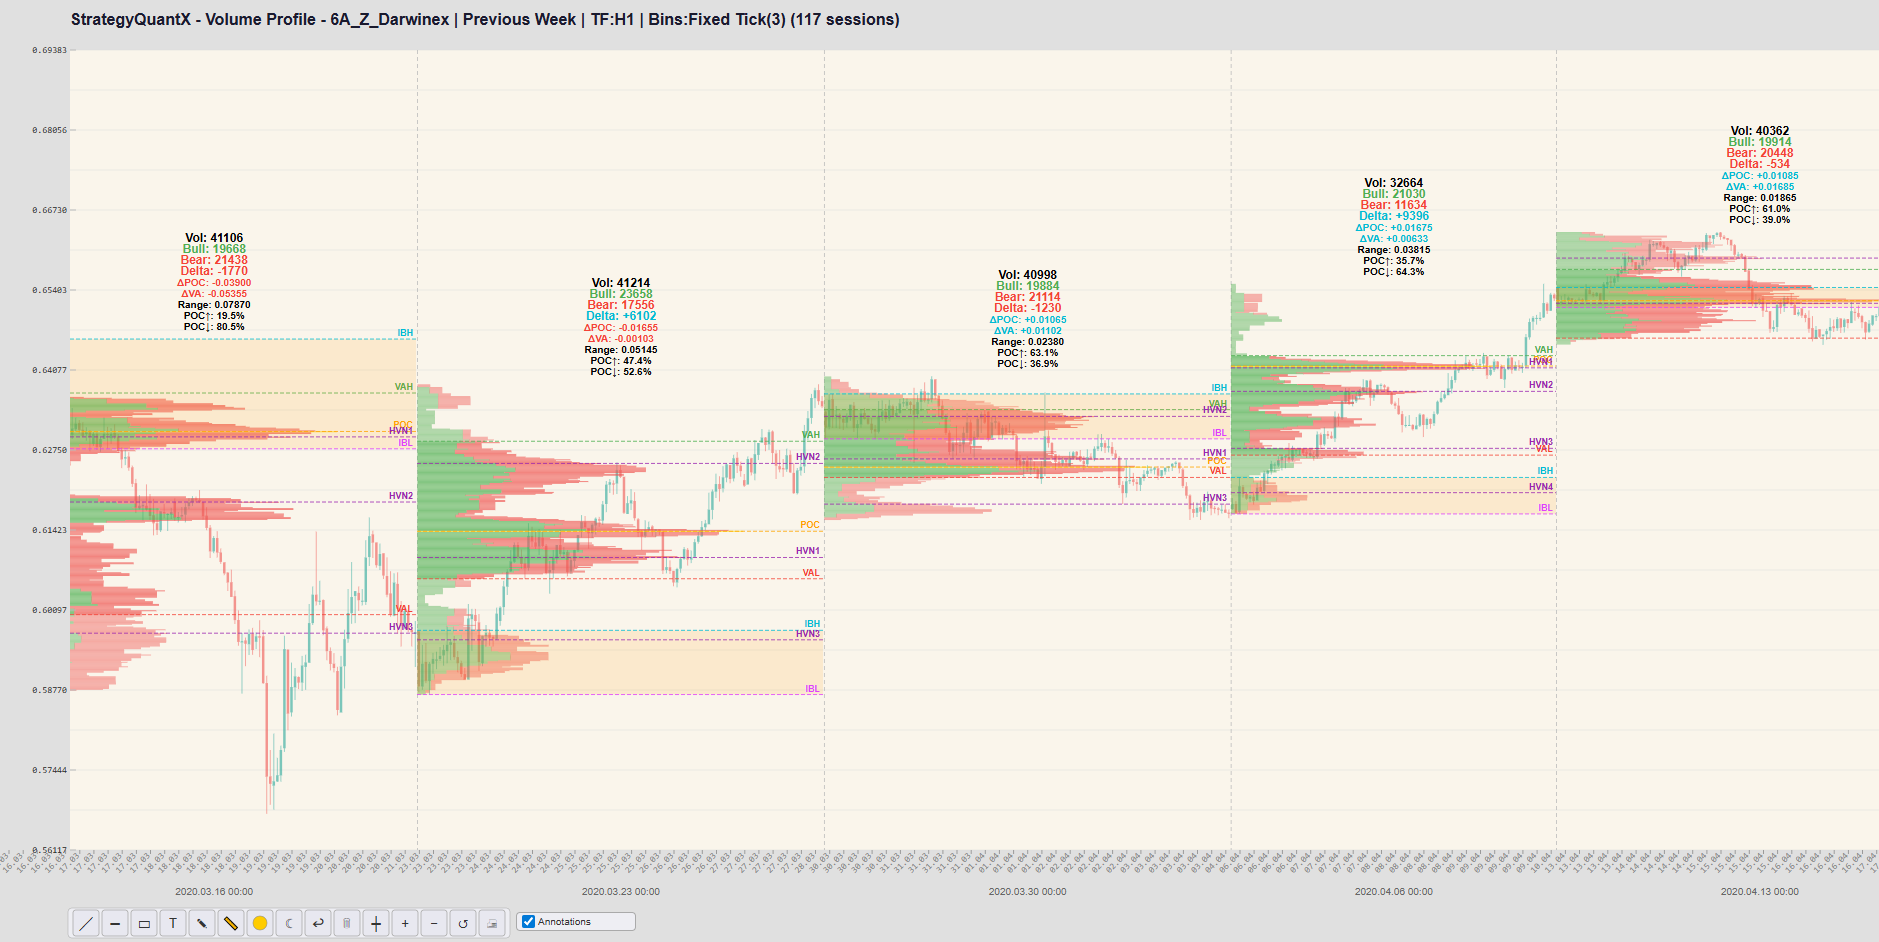
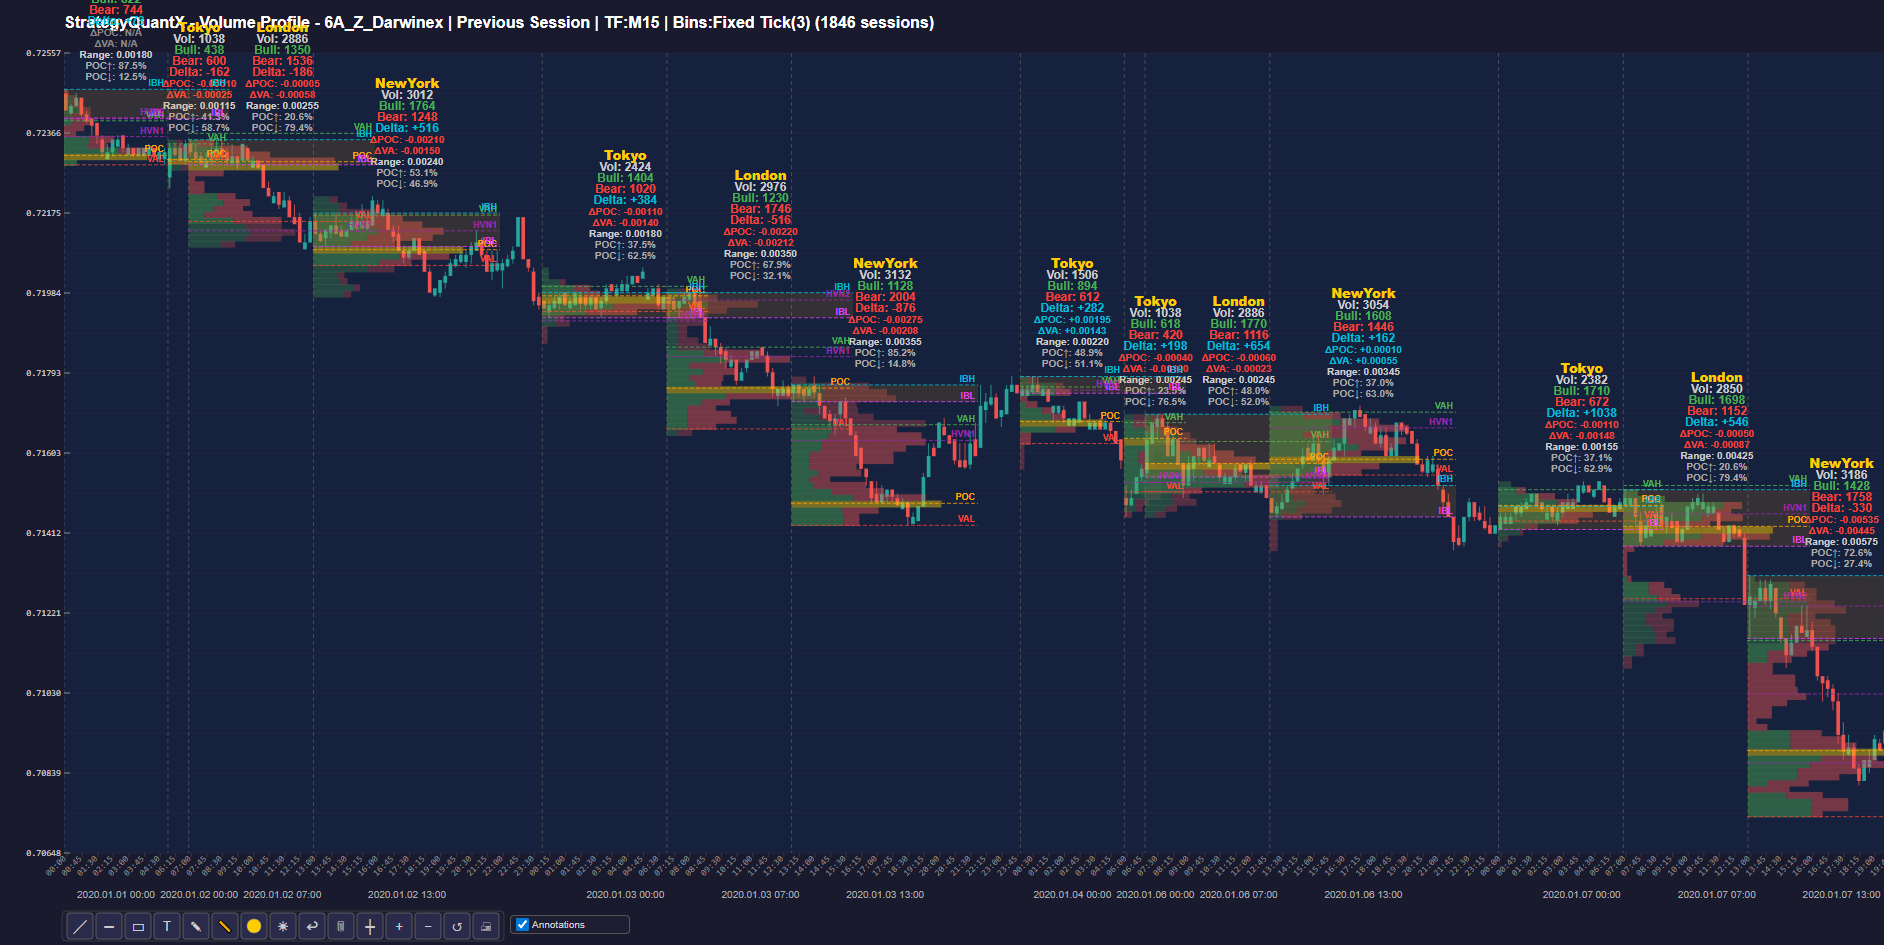
Volume Profile Shows Volume Distribution Across Price Levels
Traditional volume indicators display the total volume traded during a specific time period, such as per candle or per bar. Volume Profile solves this limitation by organizing traded volume by price instead of time.
This allows traders to see how much volume was traded at each price level, revealing the true structure of market activity.
Benefits of price-based volume distribution:
- Identifies price levels with heavy participation
- Shows where buyers and sellers agree on value
- Highlights areas of liquidity concentration
- Provides insight into market acceptance and rejection
This information is far more useful for understanding market behavior than simply observing total volume per time interval.
![]()
![]()
![]()
![]()
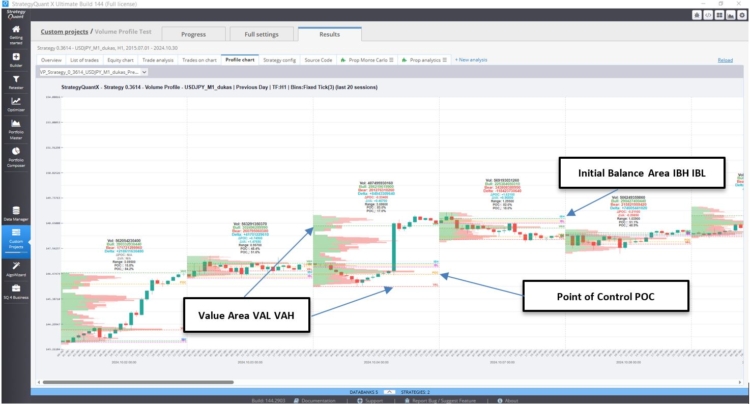
Identification of Key Market Reference Levels
Volume Profile generates important structural levels that are widely used by professional traders.
Key levels include:
- Point of Control (POC)
The price level where the highest volume was traded during the selected session.
- Value Area High (VAH)
The upper boundary of the value area, containing approximately 70% of traded volume.
- Value Area Low (VAL)
The lower boundary of the value area.
These levels often behave like natural support and resistance zones because they represent areas where the market has previously agreed on value.
Practical implications:
- Price often reverts toward the POC
- VAH and VAL frequently act as breakout or reversal levels
- Institutional traders often execute positions around these areas
These levels provide objective market structure, unlike many traditional indicators.
Detection of High and Low Volume Nodes
Volume Profile highlights High Volume Nodes (HVN) and Low Volume Nodes (LVN).
- High Volume Nodes (HVN)
These represent price levels where a large amount of trading occurred.
Interpretation:
- The market accepted these prices
- The area represents fair value
- Price tends to consolidate around these zones
- Low Volume Nodes (LVN)
These represent price levels where little trading occurred.
Interpretation:
- The market rejected these prices
- These zones often act as fast-moving areas
- Price tends to move quickly through LVNs
This provides insight into the auction process of the market, something that simple volume bars cannot show.
More Reliable Support and Resistance Levels
Many technical indicators attempt to estimate support and resistance using mathematical formulas or price patterns.
Volume Profile instead identifies support and resistance based on actual trading activity.
These levels are more reliable because they represent areas where:
- large amounts of capital were exchanged
- institutional traders were active
- the market previously found equilibrium
As a result, Volume Profile levels often produce more meaningful reactions than traditional indicator levels.
Better Detection of Institutional Activity
Large institutions typically execute orders at specific price levels where liquidity is available.
Because Volume Profile highlights areas where significant trading activity occurred, it can reveal zones where institutional participation was likely present.
Examples include:
- accumulation zones
- distribution zones
- absorption areas
These areas often influence future market behavior and can become important reference levels for future trading decisions.
Compatibility with Advanced Trading Techniques
Volume Profile integrates well with other advanced trading tools such as:
- VWAP (Volume Weighted Average Price)
- Market Profile (TPO)
- Order flow analysis
- Footprint charts
- Delta volume analysis
By combining these tools, traders can obtain a more complete understanding of market structure, liquidity, and order flow.
Suitable for Algorithmic and Quantitative Strategies
Volume Profile can be used to generate systematic trading signals.
Examples include:
- POC breakout strategies
- Value area rotation strategies
- Reversion to POC strategies
- Low-volume node breakout strategies
- Initial balance breakout strategies
Because Volume Profile generates objective levels based on traded volume, these signals can often be implemented effectively in automated trading systems.
Summary
Traditional volume indicators show how much trading occurred during a specific period of time.
Volume Profile provides deeper insight by showing where trading occurred in terms of price levels.
This difference allows traders to:
- identify fair value zones
- detect market structure
- locate liquidity concentrations
- observe institutional activity
- build more robust trading strategies
As a result, Volume Profile provides a more comprehensive view of market dynamics than simple volume indicators.
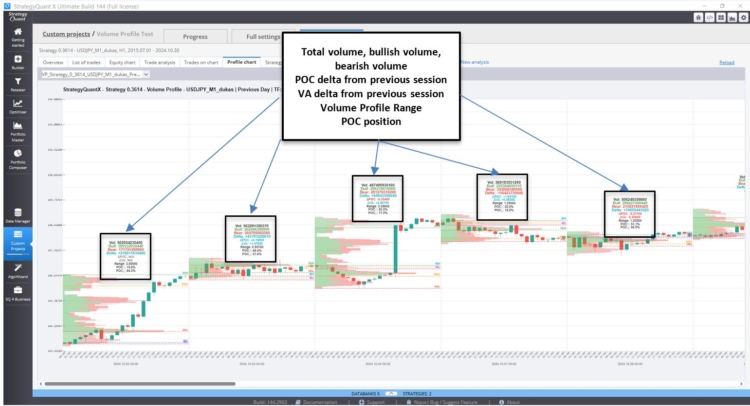
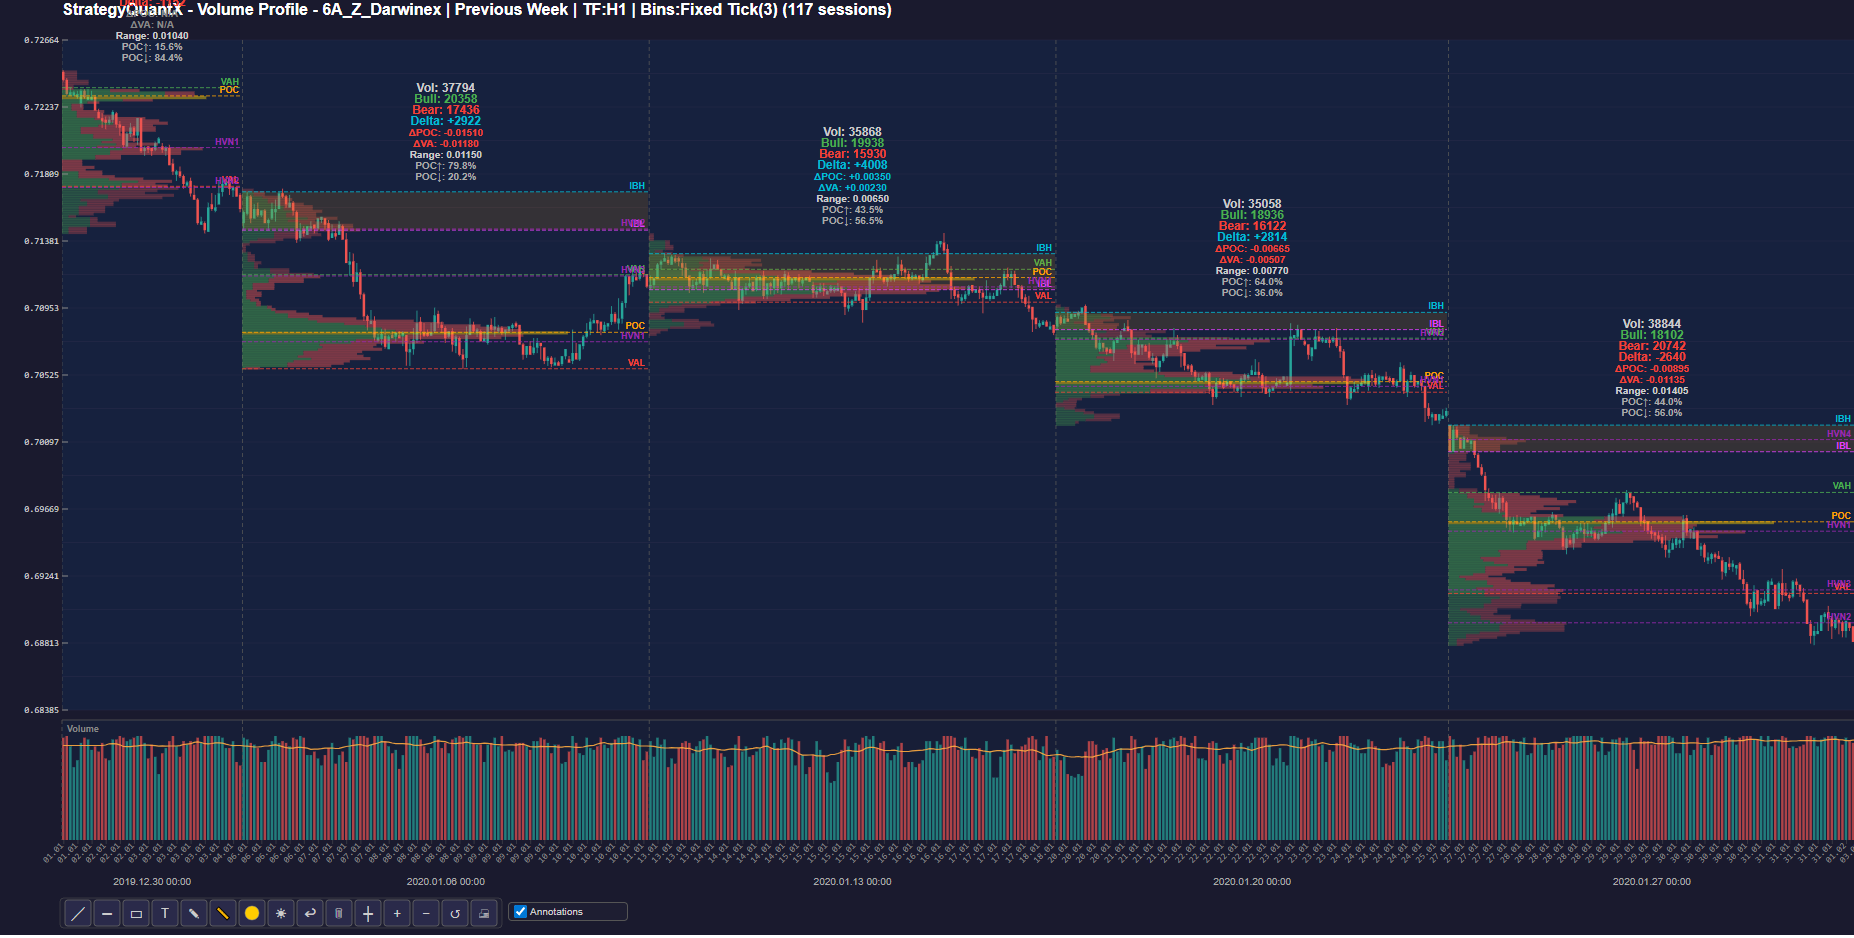
I. StrategyQuantX Volume profile Chart
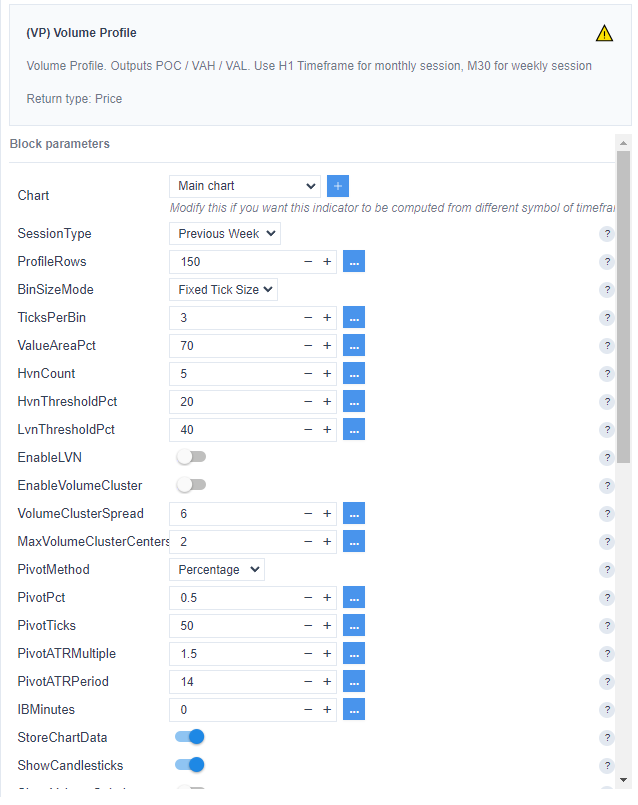
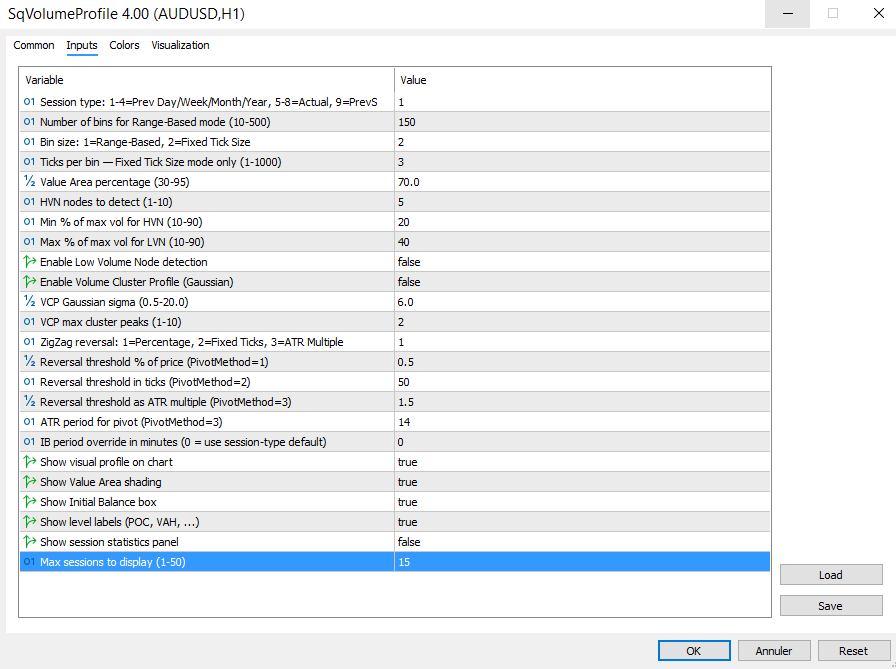
II. The Volume profile parameters
1/ To configure the Volume Profile in StrategyQuant, first select the Session Type.
- Previous Daily Session
- Previous Weekly Session
- Previous Monthly Session
- Previous Yearly Session
2/ Depending on the session type, an appropriate timeframe will be selected.
- M15 for Daily
- H1 for weekly
- H4 Monthly
3/ For consistent backtesting results, it is recommended to keep BinSizeMode set to “Fixed Tick Size.”
4/ TicksPerBin.
Depending on the selected session, the range of the Volume Profile can vary. For a daily session, the range is typically smaller, while for a monthly session it can be significantly larger.
For example, in a daily session the bin size may be 3 ticks per bin, meaning each level of the Volume Profile represents 3 ticks.
In a monthly session, the bin size may increase to 30 ticks per bin, meaning each level of the Volume Profile represents 30 ticks.
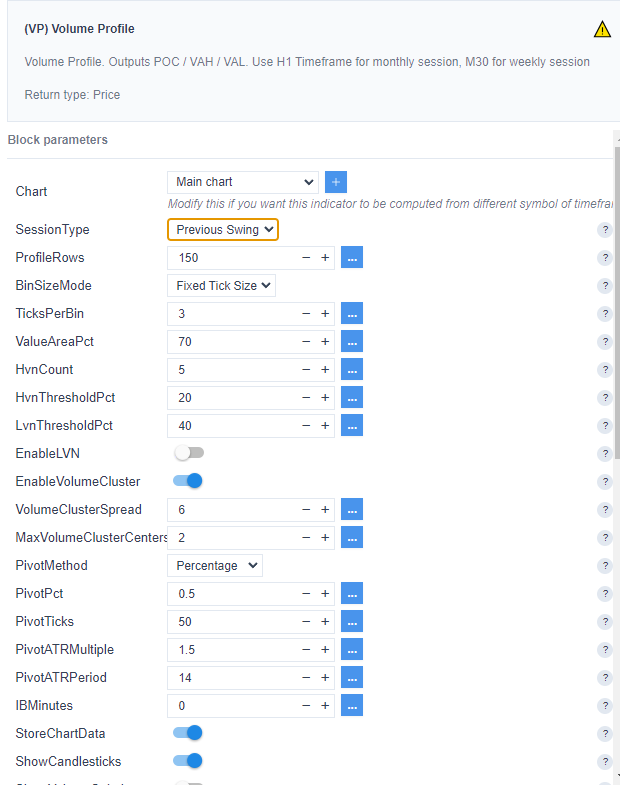
The parameters HVN Count, HVN Threshold, and LVN Threshold define how High Volume Nodes (HVN) and Low Volume Nodes (LVN) are detected in the Volume Profile. The default values usually do not require adjustment.
The EnableLVN parameter allows you to enable the detection of Low Volume Nodes (LVN).
![]()
![]()
![]()
![]()
III. Advanced Parameters of the Volume Profile
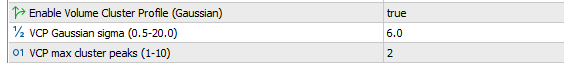
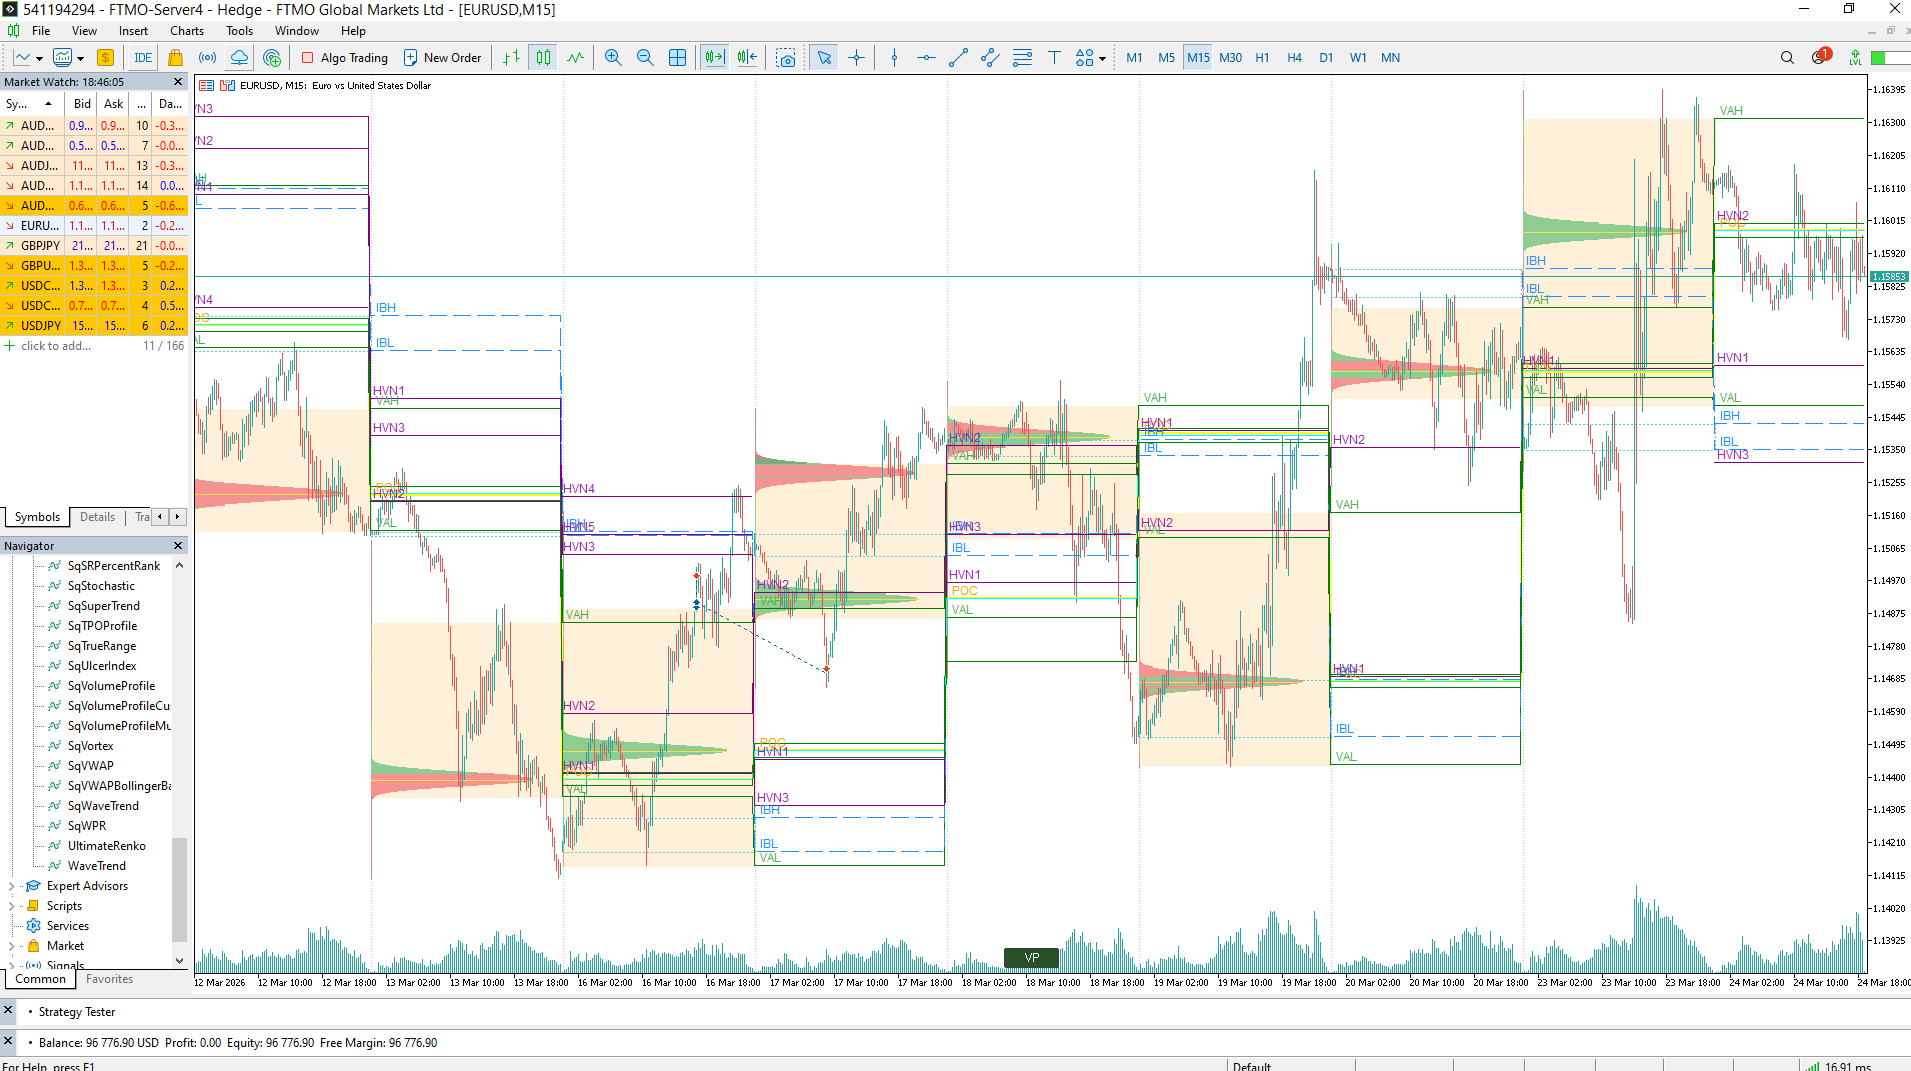
1/ Volume Cluster Profile (VCP)
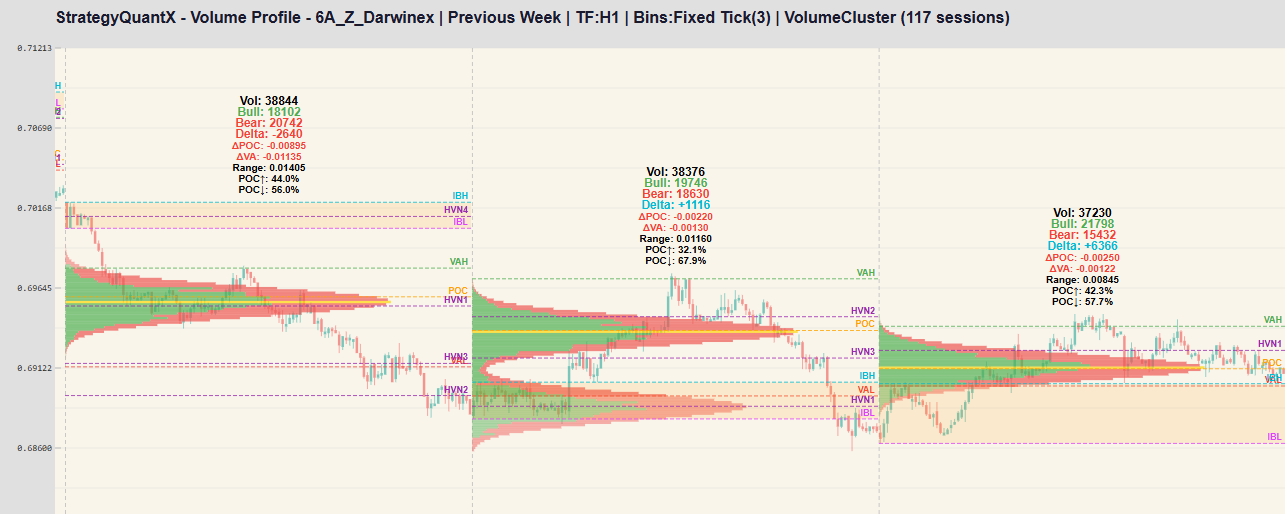
Volume Cluster Profile (VCP) is an advanced Volume Profile indicator that analyzes volume distribution by price and highlights the most important volume clusters within a trading range. Instead of displaying only a raw histogram, the indicator detects the dominant volume peaks (clusters) and smooths them using a Gaussian distribution, which spreads the influence of each cluster across nearby price levels to better reveal meaningful liquidity zones. It can build profiles for the current chart window or for previous swing segments, and it records historical profiles between pivot points.
We can set the Maximum Cluster Center : 2 or more
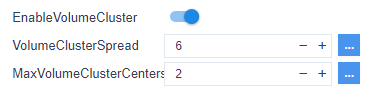
As shown below, the instrument tends to return to the previous cluster (HVN1).
![]()
![]()
2/ Swing Session
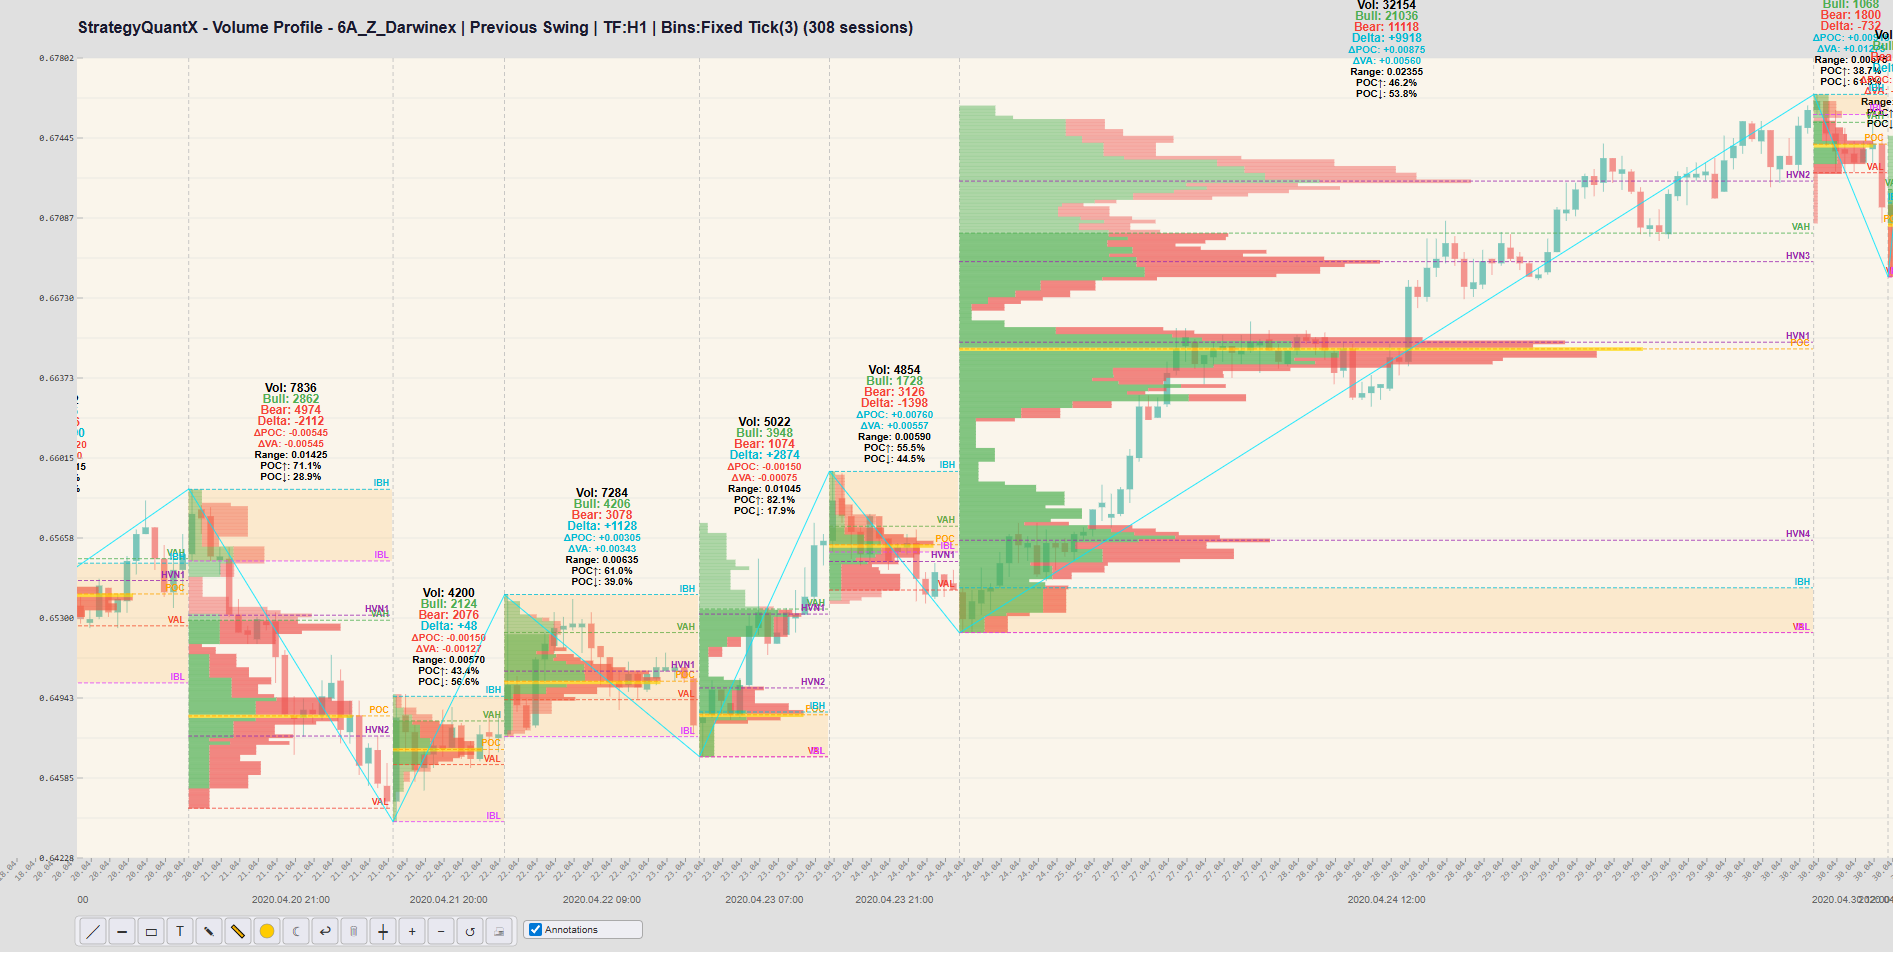
The Swing Profile combines a Zig-Zag trend detector with a Volume Profile analysis. Instead of calculating one profile for a fixed time range, the indicator creates a separate volume profile for each price swing identified by the Swing, allowing traders to analyze how volume is distributed within individual market trends.
The idea of building a Volume Profile for each market swing is particularly interesting because it aligns the analysis with the natural structure of the market rather than with fixed time periods such as sessions or days. By using a Zig-Zag algorithm to detect market reversals, a new Volume Profile can be generated for each trend segment. This allows traders to analyze how volume is distributed within a specific directional move, revealing where buyers or sellers were most active during that swing.
When price later revisits these levels, they often act as support or resistance because they correspond to areas where significant trading previously occurred. This approach is especially useful in algorithmic trading because it captures the volume structure of each market leg, helping identify accumulation zones, trend strength, and potential reversal areas more effectively than traditional session-based volume profiles.
In practice, this approach helps traders understand volume distribution inside each trend segment, detect buy/sell imbalances, and identify support and resistance levels created during market swings.
A new swing is detected based on one of the following methods: Pivot Percentage, Fixed Ticks, or a multiple of the ATR.
![]()
![]()
![]()
![]()
![]()
![]()
Depending on the instrument, it may be necessary to adjust both the timeframe and the pivot parameters.
For currency futures instruments, a 10-minute timeframe (M10) can be used.
– ShowZigZagLine
This option allows you to view the swing with swing session only
![]()
![]()
![]()
![]()
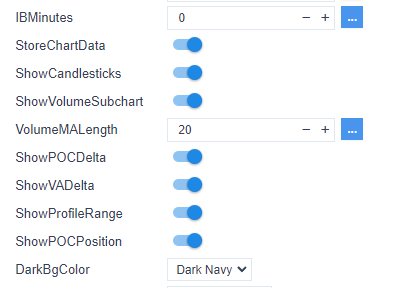
3/ Initial Balance
The Initial Balance is automatically set by default to 0.
The default periods are:
- Daily session: 60 minutes
- Weekly session: 720 minutes (12 hours)
- Monthly session: 1440 minutes (24 hours)
- Yearly session: 8640 minutes (6 days)
- Swing session: 60 minutes
You can adjust these parameters by setting the desired number of minutes.
4/ Store the Chart Data
This option allows you to view the Volume Profile.
5/ Show Candle Sticks
This option allows you to view the candle sticks with the volume profile
6/ Show Volume Subchart
This option allows you to view the volume
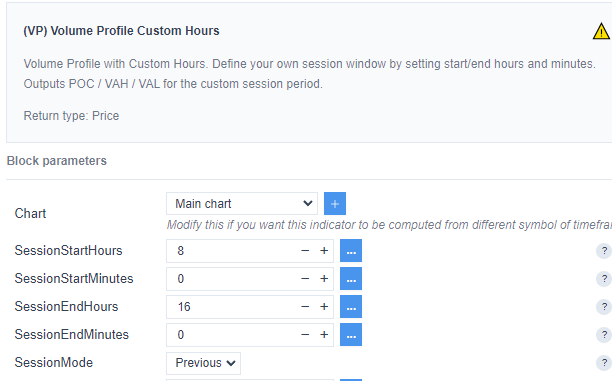
7. Custom Hour Volume Profile
A Custom Hour Volume Profile allows traders to analyze the volume distribution during a specific hour of the trading session, providing a more focused view of market activity.
Instead of studying the entire session, traders can concentrate on a precise time window and observe how price and volume behave during that period. This approach helps identify important price levels such as the Point of Control (POC), Value Area High (VAH), and Value Area Low (VAL) for that specific hour.
By isolating individual hours, traders can better understand when the highest trading activity occurs and how liquidity evolves throughout the session.
It also allows them to focus on hours that historically produce stronger price movements, improving the timing of trade entries and exits. In addition, this type of analysis makes it easier to compare market behavior between different trading periods, such as the London open and the New York open.
Custom Hour Volume Profile helps traders isolate and analyze the most relevant time periods of the trading day, leading to a clearer understanding of market dynamics and more informed trading decisions.
![]()
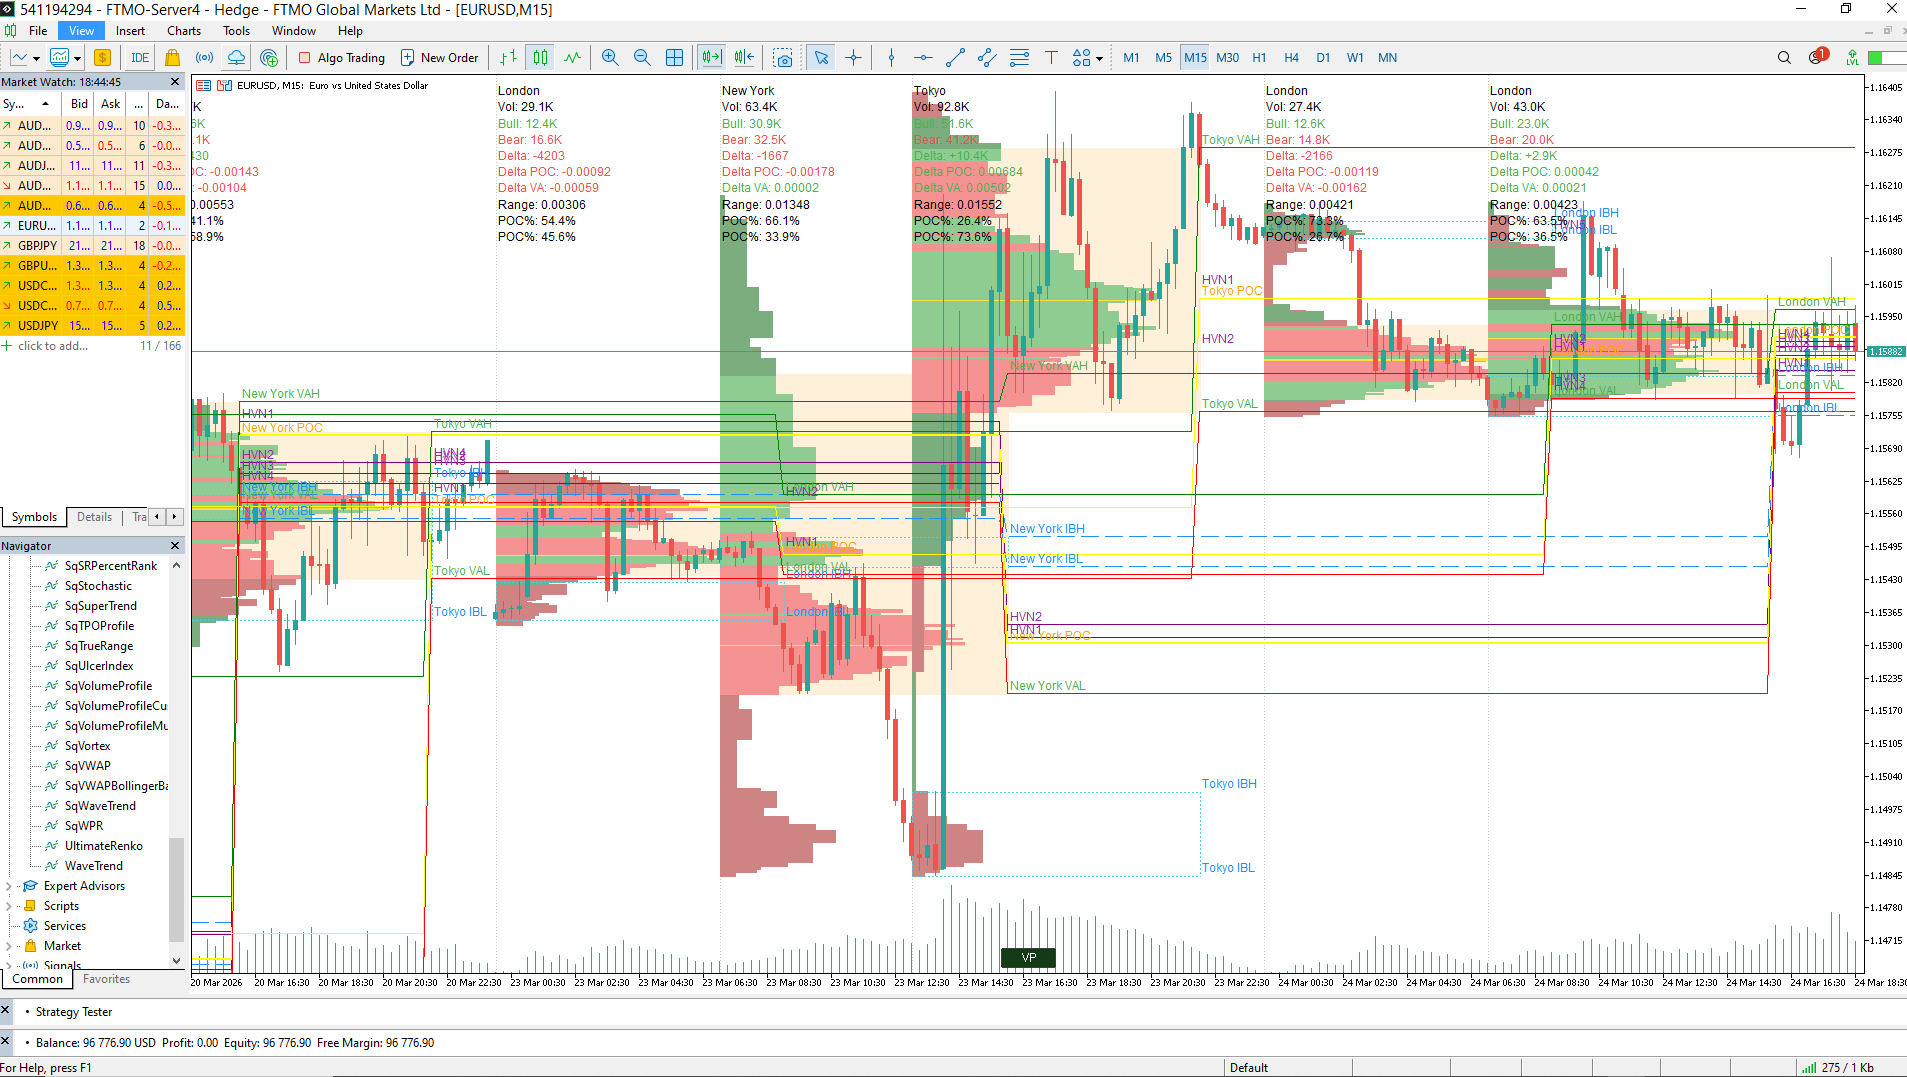
8. Multisession Volume Profile
This option displays Volume Profiles for multiple trading sessions (Tokyo, London, New York), allowing you to analyze the evolution of the instrument across different market time zones.
A Multi-Session Volume Profile allows traders to analyze how volume and liquidity evolve across different trading sessions such as Tokyo, London, and New York. By separating the profiles for each session, it becomes easier to identify where major market participants were active, detect session-specific support and resistance levels, and observe how price reacts when entering a new session. This helps traders better understand global market dynamics and the influence of each trading center on price movement.
IV. MetaTrader Volume Profile
1. Volume Profile

In MetaTrader, the display of Volume Profile statistics is controlled by the ‘Show Session Statistics Panel’ parameter.
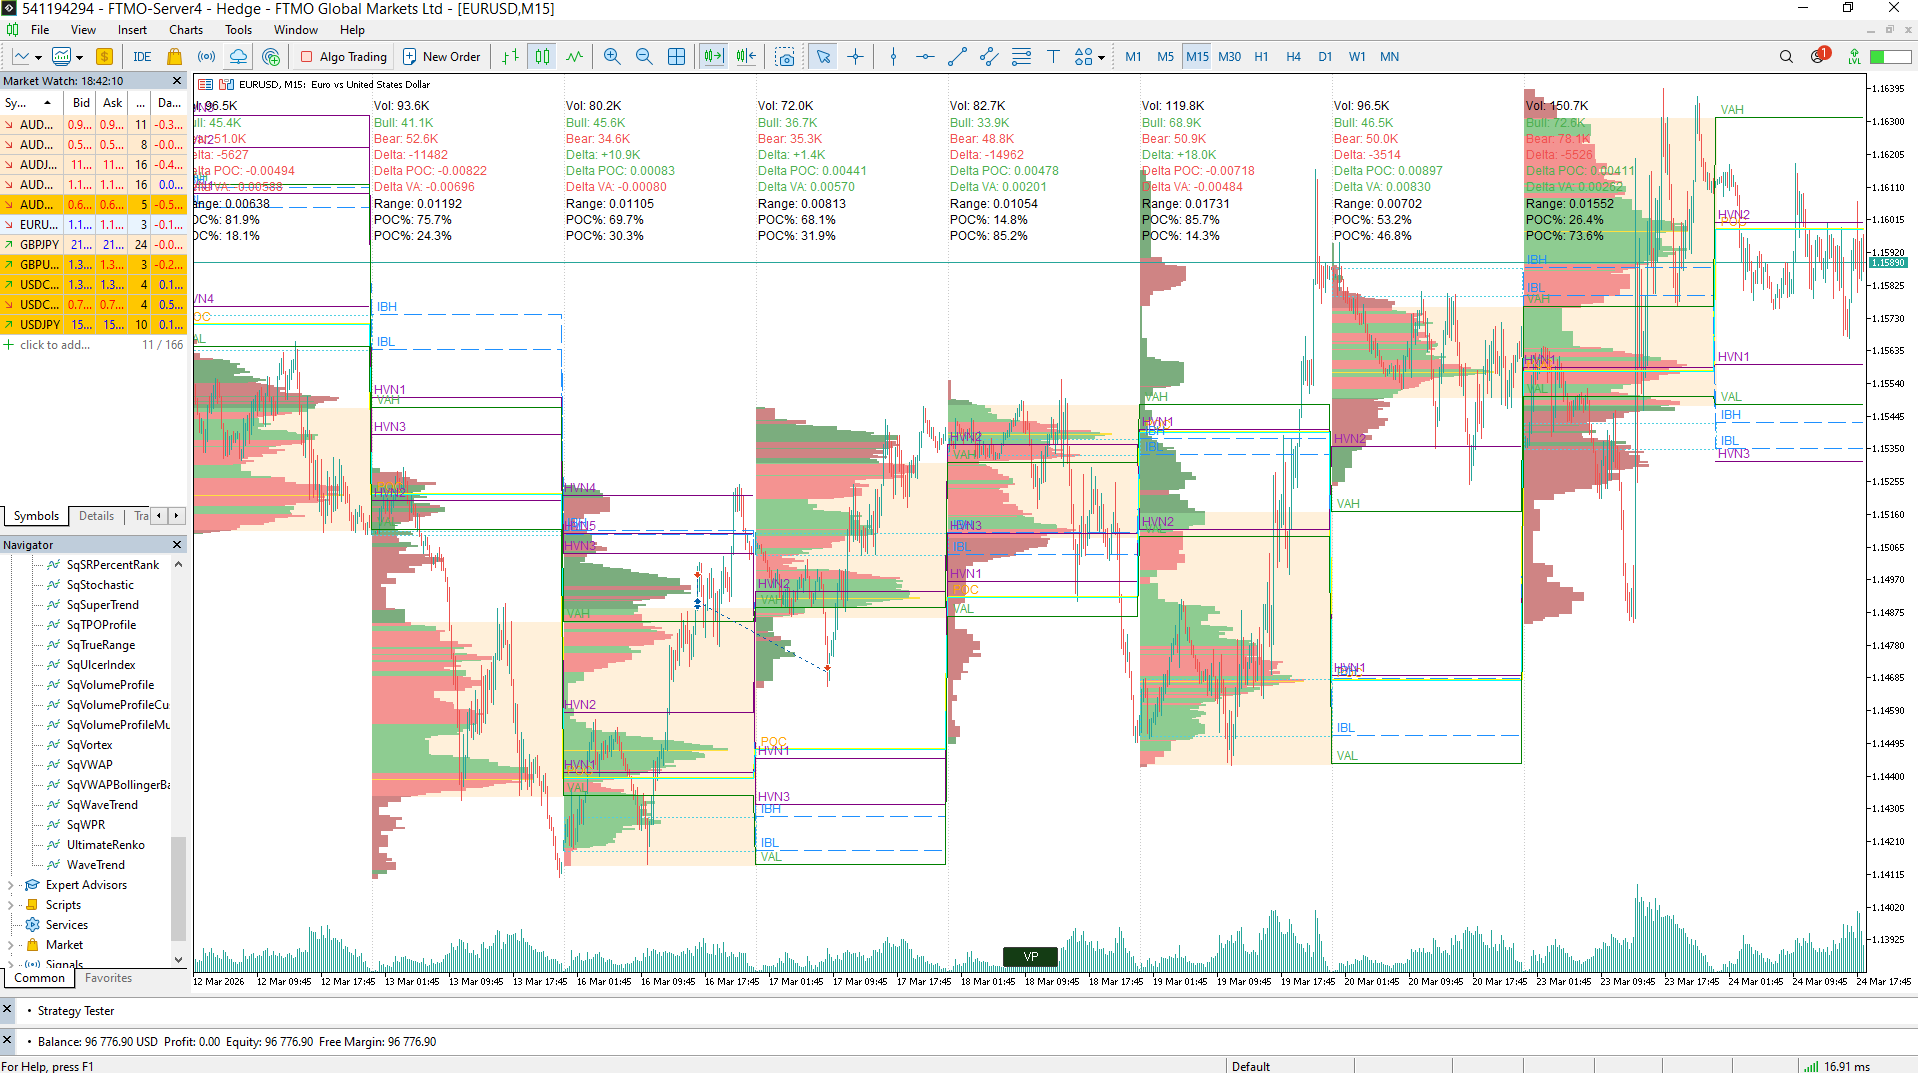
![]()
To activate the Volume Profile view, click the VP button at the bottom center of the screen.
By default, the MetaTrader Volume Profile is disabled to maintain the indicator’s performance.
You can select the number of sessions to display using the ‘Max Sessions to Display’ setting.
The Volume Profile indicator values remain available even when the view is disabled.
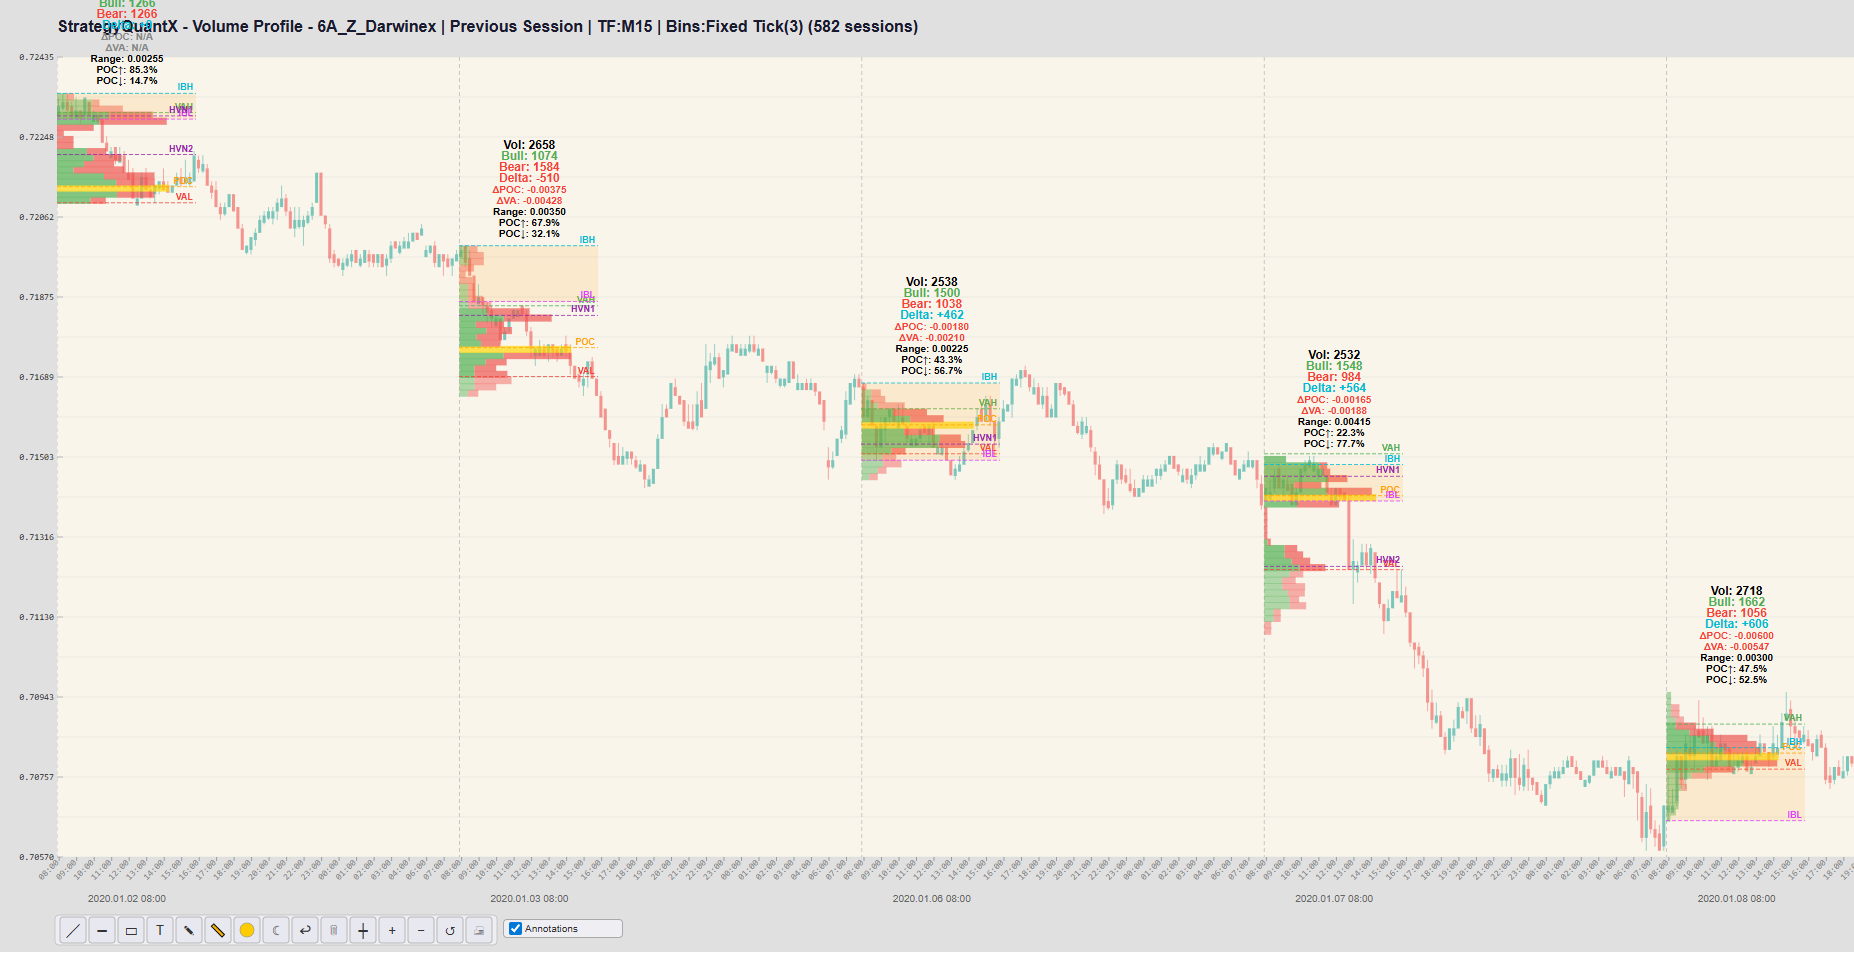
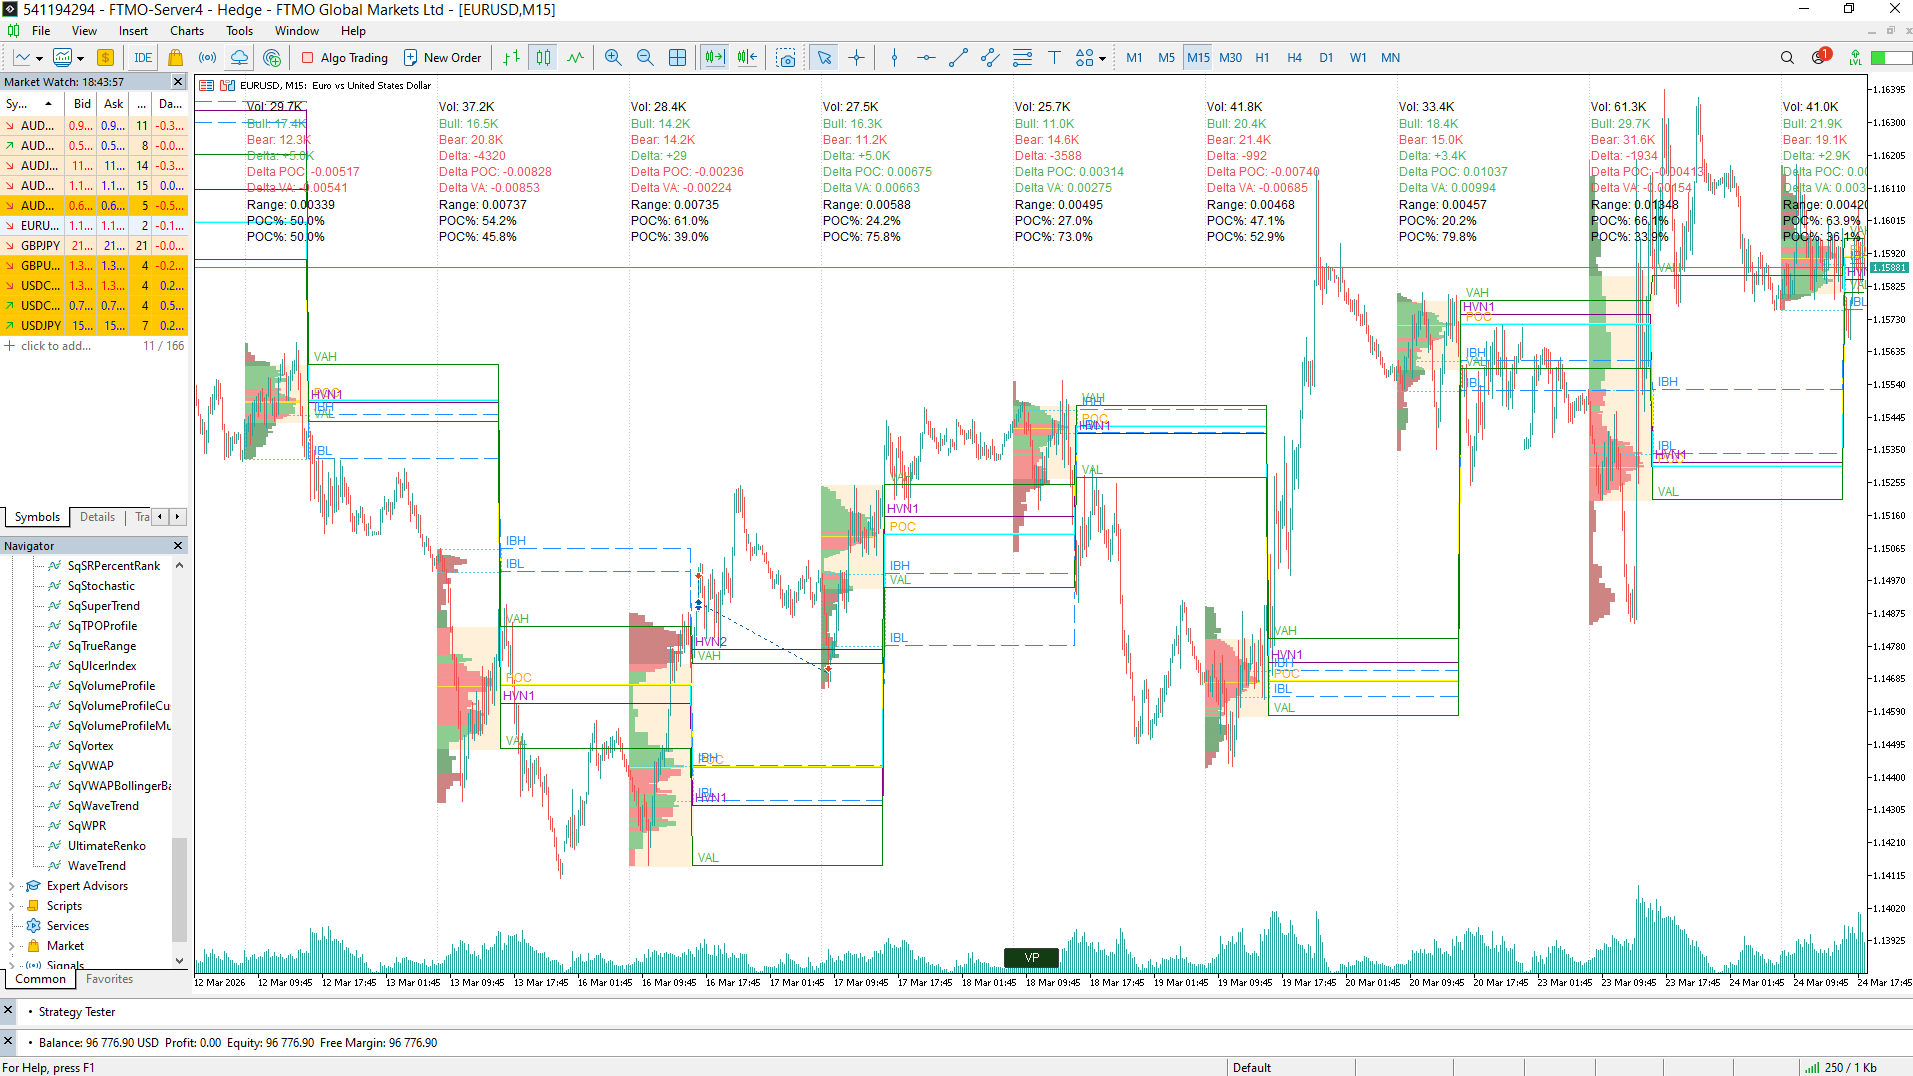
2. Volume Profile Custom Hour
The Volume Profile Custom Hour allows users to analyze the Volume Profile for a specific session.
For improved accuracy, a smaller time frame is recommended like M15
3. Volume Profile Multisession
This option displays Volume Profiles for multiple trading sessions (Tokyo, London, New York), allowing you to analyze the evolution of the instrument across different market time zones in Metatrader.
4. Volume Profile with Cluster mode
The Volume Cluster Profile (VCP) is a Volume Profile indicator that analyzes volume distribution by price in MetaTrader.
You can select the number of peaks per session using the “VCP Max Cluster Peaks” parameter and adjust the indicator using “VCP Gaussian Sigma.”
In general, the larger the session (daily, weekly, monthly), the greater the number of peaks.
How to get it to your SQX
Volume Profile and Market Profile are included in the StrategyQuant X Ultimate license. Professional and Starter users can unlock the full feature set as an add-on plugin, so you can stay on your current plan and still get access to it.
Get this feature, lifetime support updates, premium data, and other premium features: Upgrade from SQX Professional to Ultimate
12 monthly installments | One-time payment
Separate Market & Volume Profile add-ons for Starter and Professional
Monthly Subscription | Yearly Subscription
Additional resources
https://www.tradingview.com/script/lDxohpMZ-Volume-Cluster-Profile-VCP-Zeiierman/
https://www.tradingview.com/script/L2LxYayS-Zig-Zag-Volume-Profile-Bull-vs-Bear-Kioseff-Trading/
Was this article helpful? The article was useful The article was not useful