
15. 10. 2024
Documentazione
Applicazioni
Ultimo aggiornamento il 20. 1. 2025 da Emmanuel
Costruzione automatica del portafoglio
Contenuto della pagina
Si tratta di una nuova funzionalità in un nuovo Compositore di portafoglio di StrategyQuantX. Per saperne di più Compositore di portafoglio, e il differenza tra Portfolio Composer e Portfolio Master.
In breve, Portfolio Composer consente di simulare un portafoglio COMPRENSIVO di pesi (quanto denaro allocare a ciascuna strategia del portafoglio). Potete scegliere le strategie che volete testare, impostare i loro pesi e premere il pulsante Ricompila portafoglio per creare una simulazione di portafoglio.
Calcolo automatico del portafoglio
La nuova funzione di Calcolo automatico aggiunge un approccio automatizzato. Non è più necessario specificare manualmente i pesi: si possono usare modelli come Frontiera efficiente di Markowitz (ne verranno aggiunti altri) per calcolare le ponderazioni ottimali del portafoglio e della strategia!
Portfolio Composer: Automatizzare la Frontiera Efficiente di Markowitz per la ponderazione ottimale delle strategie
Nel mondo del trading, in continua evoluzione, la costruzione di un portafoglio ottimale di strategie richiede di bilanciare il potenziale di rendimento con livelli di rischio accettabili.
Compositore di portafoglio introduce un nuovo livello di automazione sfruttando la tecnologia Frontiera efficiente di Markowitz per calcolare il pesi ottimali per ogni strategia. Questa funzione avanzata garantisce ai trader di ottenere sistematicamente il massimo rendimento possibile per un determinato livello di rischio. Automatizzando questi calcoli complessi, Portfolio Composer non solo semplifica il processo di ottimizzazione del portafoglio, ma consente anche ai trader di prendere decisioni basate sui dati con fiducia.
Che cos'è la frontiera efficiente?
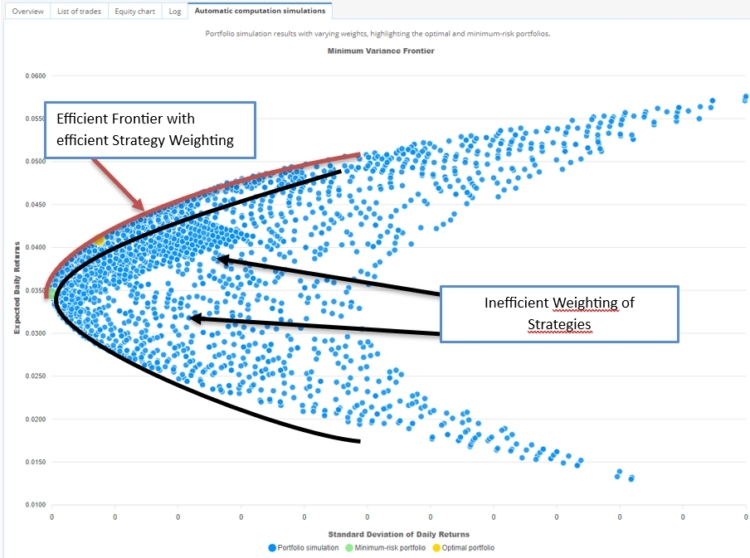
Il Frontiera efficiente è un concetto chiave in Teoria moderna del portafoglio (MPT) che rappresenta un insieme di portafogli ottimali che offrono il massimo rendimento atteso per un determinato livello di rischio (o il minimo rischio per un determinato livello di rendimento). I portafogli che si trovano sulla frontiera efficiente dominano quelli che si trovano al di sotto di essa perché offrono rendimenti migliori a parità di rischio o meno rischi a parità di rendimento.
La frontiera efficiente è tipicamente tracciata come una curva su un grafico in cui:
- Asse X: Rappresenta il rischio, misurato dalla deviazione standard del portafoglio (volatilità).
- Asse Y: Rappresenta il rendimento atteso del portafoglio.
I portafogli che si trovano al di sotto della frontiera efficiente vengono considerati inefficiente, in quanto sono disponibili migliori combinazioni di rischio-rendimento. I portafogli sulla frontiera sono ottimali e sono considerati efficienti.
Il rendimento atteso / la deviazione standard (volatilità) rappresentano lo Sharpe ratio del portafoglio.
Il Portafoglio ottimale è il portafoglio con lo Sharpe Ratio più elevato.
Chi l'ha creato?
La frontiera efficiente è stata introdotta da Harry Markowitz, economista americano, nel suo lavoro pionieristico sulla teoria del portafoglio. Il suo articolo del 1952, "Selezione del portafoglio", pubblicato nel Giornale della finanza, ha gettato le basi della moderna Teoria del Portafoglio. Per questo lavoro è stato successivamente premiato con il Premio Nobel per le Scienze Economiche in 1990.
La frontiera efficiente si basa su rendimento giornaliero, volatilità del portafoglio e valore a rischio:
1. Calcolo del rendimento giornaliero
Il ritorno giornaliero misura la variazione percentuale del valore di un'attività o di un portafoglio da un giorno di negoziazione all'altro. Per un'attività, si calcola come:
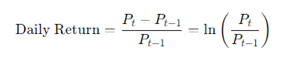
- Pt è il prezzo dell'attività al tempo t.
- Pt-1 è il prezzo dell'attività nel giorno precedente.
2. Calcolo della volatilità della strategia
Il volatilità di una strategia si riferisce a quanto i rendimenti di quella strategia fluttuano nel tempo. Viene comunemente misurato utilizzando il deviazione standard dei rendimenti giornalieri. Un'alta volatilità indica maggiori oscillazioni dei rendimenti, mentre una bassa volatilità suggerisce una performance più stabile. Per una singola strategia di trading, la volatilità giornaliera può essere calcolata come segue:
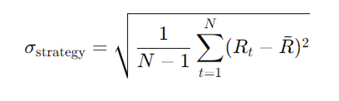
- Rt è il rendimento giornaliero della strategia nel giorno t.
- è il rendimento medio giornaliero della strategia nel periodo.
- N è il numero totale di giorni di negoziazione.
- Sigma della strategia è la deviazione standard, che rappresenta la volatilità della strategia. (o il rischio)

Poiché il rendimento oscilla intorno al rendimento medio giornaliero, calcoliamo la volatilità della strategia con un livello di confidenza del 95 %, il che significa che 95% dei punti si troveranno in questo intervallo e solo 5 giorni su 100 potrebbero essere superiori alla volatilità calcolata.
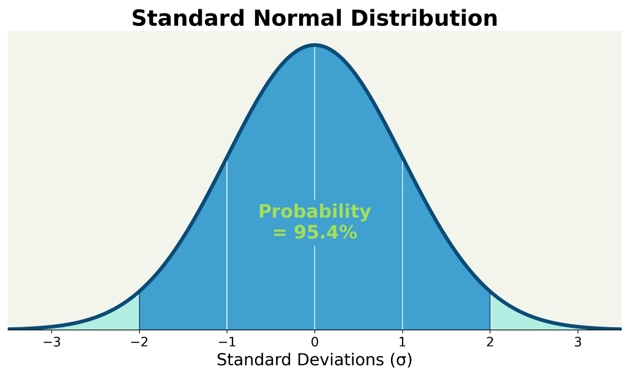
Questo calcolo presuppone una distribuzione normale del rendimento intorno al rendimento medio giornaliero in condizioni di mercato normali.
3. Livello di confidenza e VaR (Value at Risk)
A un 95% livello di confidenza, possiamo stimare la perdita potenziale del portafoglio utilizzando Valore a rischio (VaR). Il VaR stima la massima perdita attesa in un determinato periodo di tempo, ipotizzando condizioni di mercato normali. Per un portafoglio con rendimenti normalmente distribuiti, il VaR con confidenza 95% è dato da:

Dove:
- 1,65 il z-score corrispondente a un livello di confidenza di 95%. (utilizzando una tabella z o una calcolatrice per ottenere lo z-score)
- Sigma Portfolio è la volatilità giornaliera del portafoglio.
- T è l'orizzonte temporale (ad esempio, 1 giorno, 5 giorni).
In base al rendimento atteso, alla volatilità e al valore a rischio, possiamo selezionare il portafoglio più efficiente.
Applicazione in Portfolio Composer:
1. Prima fase: calcolo del portafoglio:
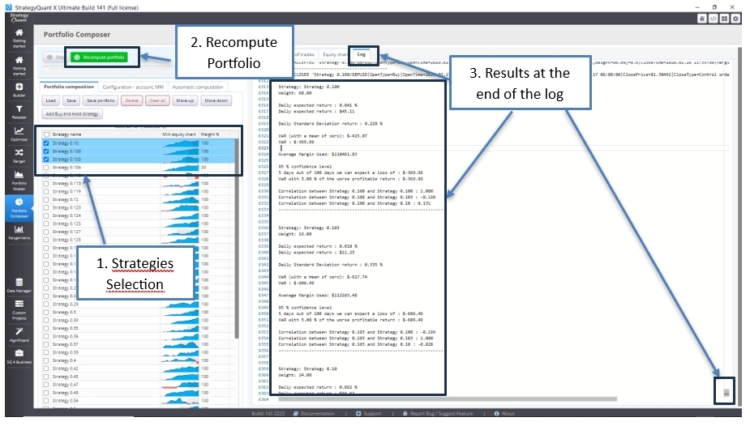
Questo primo metodo analizza un portafoglio
Se ricalcoliamo alcune strategie selezionate, possiamo leggere l'ultima riga del log per ogni strategia:
- Il rendimento atteso giornaliero
- La deviazione standard giornaliera (il rischio della strategia)
- Il valore a rischio
- La correlazione tra le strategie
Poi possiamo leggere le informazioni sul portafoglio:
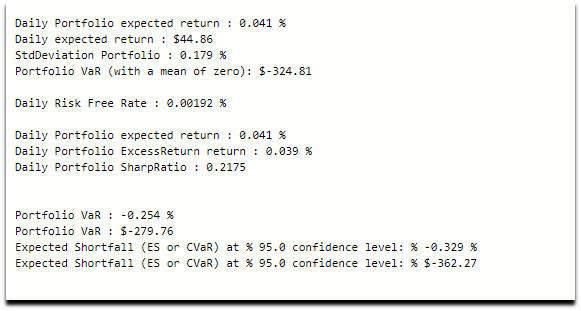
- Il Rendimento atteso giornaliero
- Il Deviazione standard giornaliera (il rischio del Portafoglio)
- Il Valore a rischio del portafoglio (VaR)
- Il Rapporto di Sharpe del Portafoglio
- Poi il Mancanza di copertura prevista (o il Valore Condizionato a Rischio)
Aggiungiamo il deficit atteso quando il mercato non è in condizioni normali e non rientra nella distribuzione normale.
2. Calcolo automatico del portafoglio:
Questo secondo metodo analizza più portafogli con diverse combinazioni di pesi.
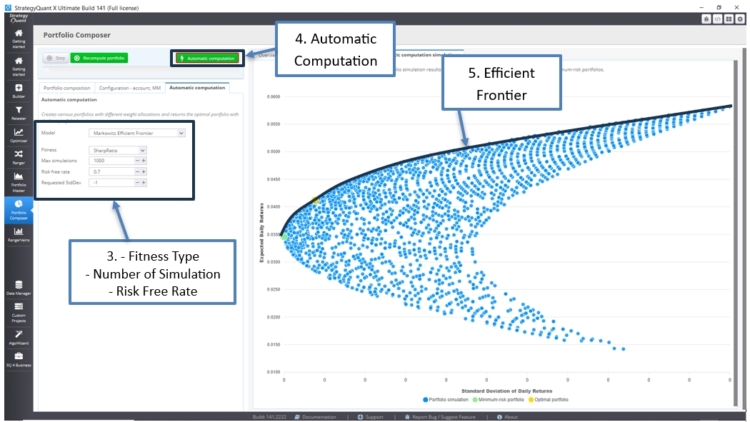
2.1 Il Sharpe Ratio fitness calcolo:
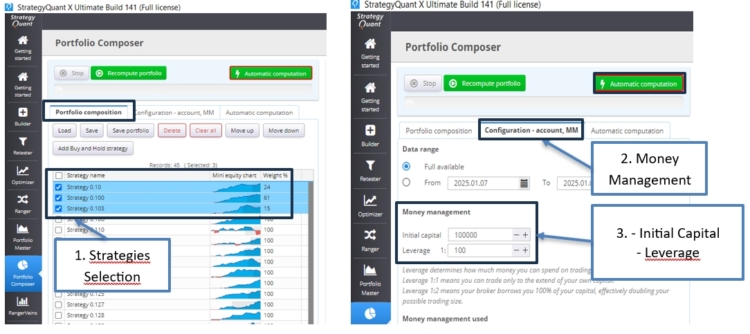
Possiamo selezionare le strategie, configurare il money management con le sue impostazioni, quindi selezionare il tipo di fitness e il numero di simulazioni, ad esempio:
- Selezioniamo 3 strategie
- Nella scheda Gestione del denaro, inseriamo una leva del 100
- Nella scheda Calcolo automatico, selezioniamo come fitness: Rapporto di Sharpe
- 500 o 1000 simulazioni
- Il tasso privo di rischio, si basa su un'attività a rischio minimo come le obbligazioni.
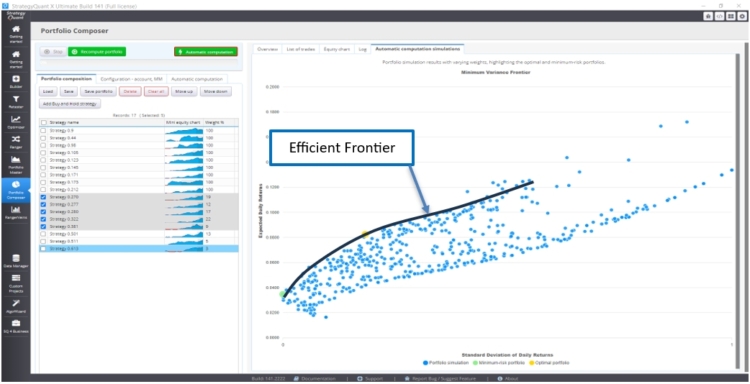
Otteniamo i seguenti risultati: il portafoglio ottimale è evidenziato in giallo e rappresenta il miglior rapporto Sharpe (rendimenti/deviazione standard).
Inoltre, il portafoglio con il rischio minimo è evidenziato in verde.
I portafogli ottimali si trovano sulla linea della frontiera efficiente. A seconda della deviazione standard (volatilità), possiamo scegliere il portafoglio che offre il massimo rendimento.
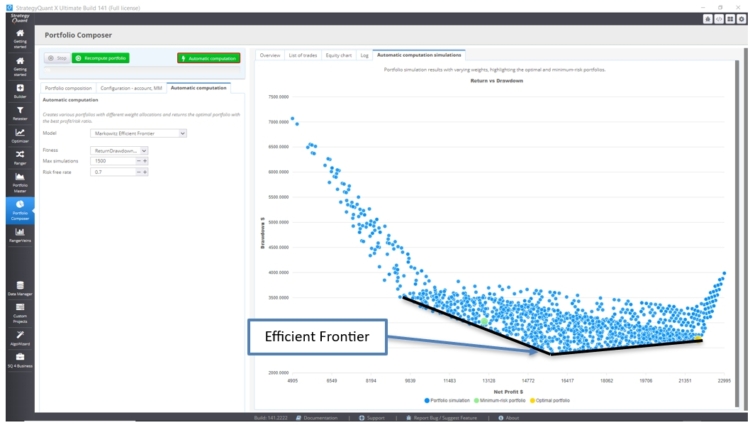
2.2 Il Rapporto tra rendimento e drawdown calcolo del fitness:
In alternativa, si può selezionare la voce Rapporto rendimento/prelievo fitness per ottenere una prospettiva diversa sui risultati:
Il portafoglio ottimale, in giallo, sarebbe il più basso drawdown con il massimo profitto. Possiamo confrontarlo con il portafoglio a rischio minimo (in verde).
I portafogli ottimali si trovano sulla linea della frontiera efficiente. A seconda del drawdown, possiamo scegliere il portafoglio che offre il massimo profitto.
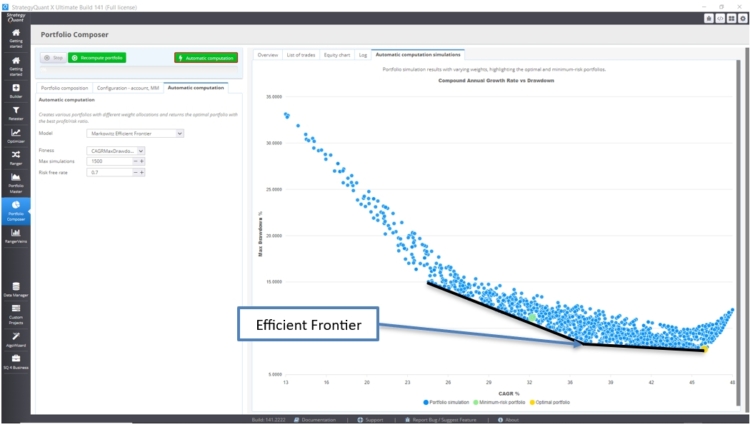
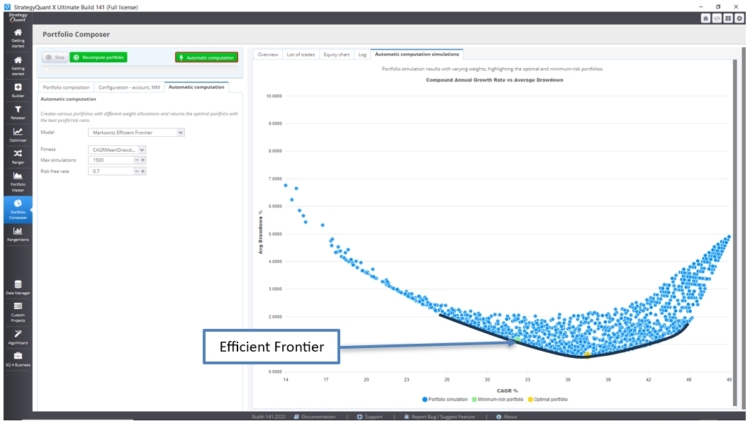
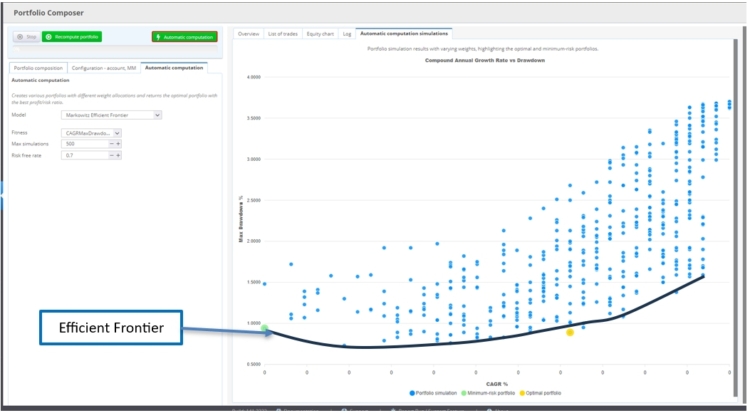
2.3 Il Tasso di crescita annuo composto vs. Drawdown massimo calcolo del fitness:
Utilizzo Tasso di crescita annuale composto (CAGR) vs. Massimo Fitness basato sul drawdown per confrontare la ponderazione del portafoglio fornisce una buona prospettiva tra Crescita a lungo termine e sensibilità al rischio.
Per ottenere il portafoglio ottimale, cercheremo il valore il CAGR più alto e il drawdown massimo più basso. (in giallo)
I portafogli ottimali si trovano sulla linea della frontiera efficiente. A seconda del drawdown, possiamo scegliere il portafoglio che offre il massimo CAGR.
2.4 Il Tasso di crescita annuo composto vs. prelievo medio calcolo del fitness:
Utilizzo il Tasso di crescita annuale composto (CAGR) rispetto al rapporto di drawdown medio sarà meno sensibile ai portafogli con drawdown anomali.
I portafogli ottimali si trovano sulla linea della frontiera efficiente. A seconda del drawdown, si può scegliere il portafoglio che offre il massimo CAGR.
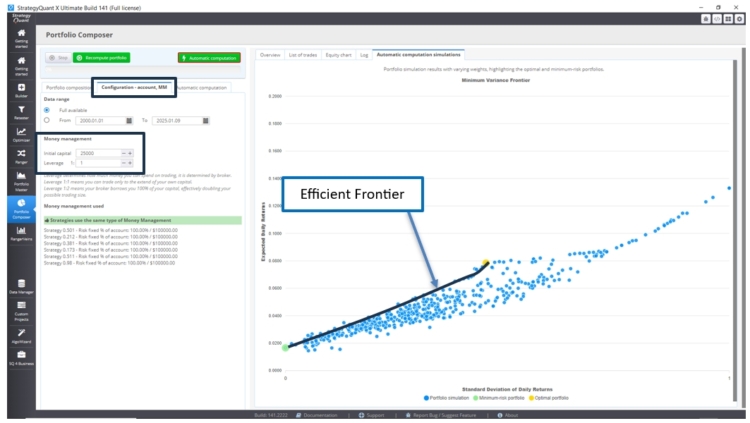
3. AlgoCloud Stockpicker
Per AlgoCloud Stockpicker, nella sezione "Configurazione - Conto MM", la leva deve essere impostata a 1, come se si trattasse di azioni. Un capitale iniziale di $25.000 può essere utilizzato come punto di partenza per l'ottimizzazione.
La forma della frontiera efficiente sarà leggermente diversa, poiché stiamo lavorando con strategie ottimizzate che operano su più strumenti.
Poiché ogni strategia coinvolge centinaia di strumenti, è necessario più tempo per eseguire l'ottimizzazione quando si utilizzano più strategie.
Ecco il Frontiera efficiente del rapporto di Sharpe Fitness:
Ecco la frontiera efficiente del CAGR Max Draw Down Fitness:
Ecco la frontiera efficiente del Rendimento vs. Drawdown Fitness:
Per riferimenti e per una comprensione più completa:
Libri
- "Selezione del portafoglio" di Harry Markowitz, Parte III: "Portafogli efficienti", Capitolo VII: "Analisi geometrica" (Yale University Press)
Un estratto - "Modern Portfolio Theory and Investment Analysis" di Edwin Elton, Martin Gruber, Stephen Brown e William Goetzmann (Wiley Custom Publishing), Parte II: "Portfolio Analysis", Capitoli 6, 9 e 11: "Tecniche di calcolo della frontiera efficiente".
- "The Complete Guide to Portfolio Performance" di Pascal François e Georges Hubner (Wiley Custom Publishing), con il capitolo "Classical Performance Measures Revisited" (Capitolo 6).
- "Portafogli intelligenti" e "Trading sistematico" di Robert Carver
Nota: abbiamo altri buoni libri di Harry Markowitz e altri, ma sono più teorici.
Sul web
- La frontiera efficiente:
Investopedia - Frontiera efficiente
Istituto di finanza aziendale - Frontiera efficiente
Darwinex e Ryan O'Connell hanno realizzato ottimi video su YouTube sull'ottimizzazione del portafoglio e sulla frontiera efficiente.
- L'intervallo di confidenza:
Scribbr - Intervallo di confidenza - Per ottenere la variabile Z da un livello di confidenza:
Study.com - Come trovare il valore Z critico
Questo articolo è stato utile? L'articolo è stato utile L'articolo non è stato utile
Questi aggiornamenti sono disponibili se si acquista lo strategyquant PRO, o sono disponibili solo per lo strategyquant ULTIMATE?
È necessario utilizzare la versione Ultimate per avere capacità illimitate nella creazione di portafogli.
Sarebbe bello se la nuova funzione consentisse di caricare i file QA.
Salve, mi chiedevo quale sia il numero che devo inserire nel tasso risk free. Se è paragonato a un'obbligazione, significa che il numero è per esempio 3% => 0.03 e non 0.7 per default?
Grazie in anticipo.