Documentation
Applications
Last updated on 17. 2. 2021 by Mark Fric
Indicators calibration (new in B131)
The indicators calibration functionality is useful when you want to automatically set up your building blocks to use values that are in an effective range. After calibration, the resulting min/max/step values of each indicator will reflect the useful range depending on your data settings. This can lead to more effective build, because values that will never exist in the chart won’t be used.
The calibration process works like this:
- Every indicator is initialized using default values for its parameters and it is then run on the whole history data from data settings.
- The calculated values for each bar are stored in a memory and then the effective min and max values are computed from all values.
- Min value is calculated as mean average – standard deviation whereas max is calculated as mean + standard deviation.
- A step value computation depends on your steps settings in Calibrate indicators popup.
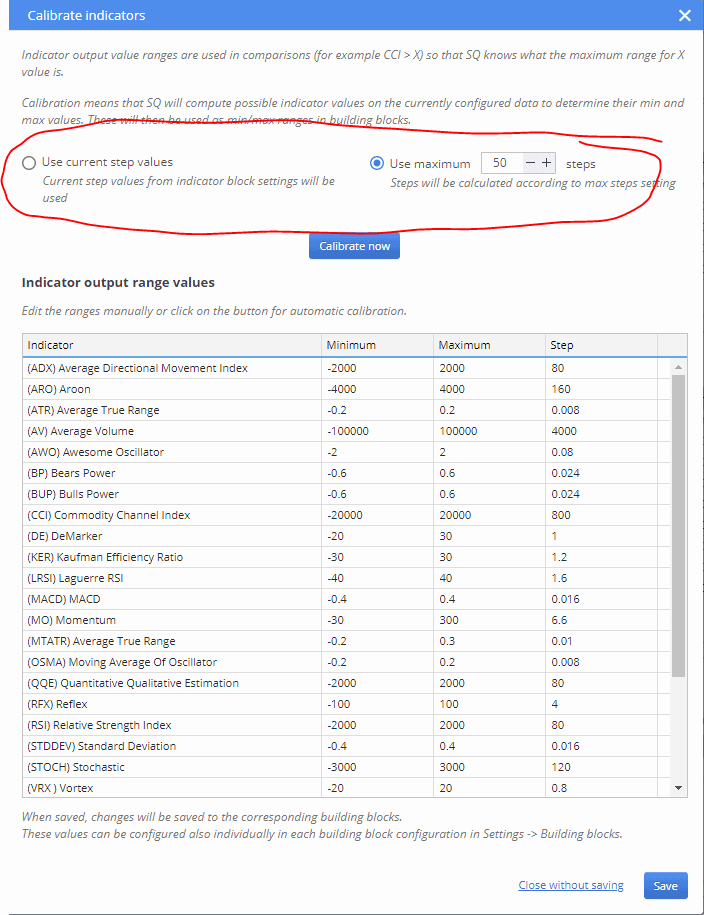
The calibration can be started by clicking the Calibrate now button or you can check the calibrate before start switch in Building blocks settings tab and the calibration will be performed automatically during each project start.
After the calibration process has been done, the results are displayed in the indicators table below. You can manually adjust the table values if you need to. After clicking Save, the indicator values will be set into building blocks and saved.
A default calibration using only the default values for each indicator may not be so effective, because the computation is done by using single settings only for each indicator and the output values strongly depend on the individual parameters settings. Because of that, we have introduced a more advanced calibration process that is able to run more instances of the same indicator each with different parameter settings.
This way the output values better reflect the real values that can be run into during build. The results computation algorithm is the same as during the default single instance calibration described earlier. The only difference is that there are more instances run for each indicator and the output values from each one are stored together in memory.
To be able to setup the extended calibration process and define custom parameter settings for each indicator, we have created a configuration file calibrationSettings.txt inside user/settings/ folder.
You can customize the settings according to you needs and use case. If you don’t specify any settings, the defaults will be used.
The format of the file is pretty straightforward, you can comment lines using # as a first character, empty lines are skipped by default and the naming convention is the same as in Java snippets.
You can set up just some parameters of an indicator, or all, it depends on you. You can also disable computation of some indicator’s output buffers. It may slightly fasten the calibration process. For example you can disable the main line of ADX indicator, because it is a middle line between +DI and -DI and thus it will have no impact on the calibration results.
Just for a demonstration purposes, let’s take a look on a sample configuration below:
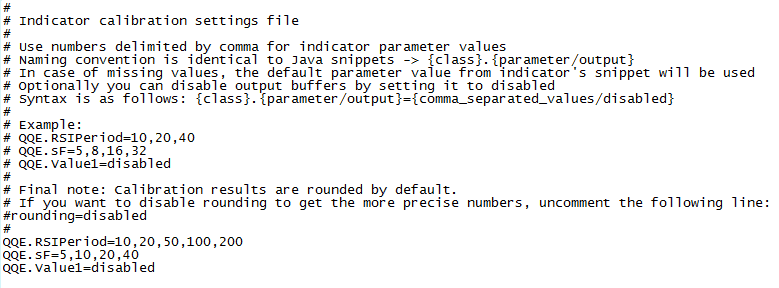
Here we are setting calibration settings for QQE indicator. We want to use custom settings for RSIPeriod and sF. We don’t want to compute the values of Value1 output buffer, so we set it to disabled. Those settings will produce totally 5 instances of QQE indicator during calibration process. The final parameter settings will be as follows:
| Instance # | RSI Period | sF | wF |
| 1 | 10 | 5 | 4.236 |
| 2 | 20 | 10 | 4.236 |
| 3 | 50 | 20 | 4.236 |
| 4 | 100 | 40 | 4.236 |
| 5 | 200 | 5 | 4.236 |
The red numbers inside the table are the default parameter values. The default value for sF is 5, for wF is 4.236.
You may have noticed another setting in the comments inside the sample configuration file – rounding=disabled. By default we beautify the presented calibration results a little bit after the calibration has been done. We do a little rounding so that the values look better and don’t contain too much decimals. However if you want to get more precise values, you can disable the rounding by uncommenting the line. Here is demonstration of how will the results change depending on the rounding.
These are the default rounded results for my build config:

These are the same results, but without rounding:
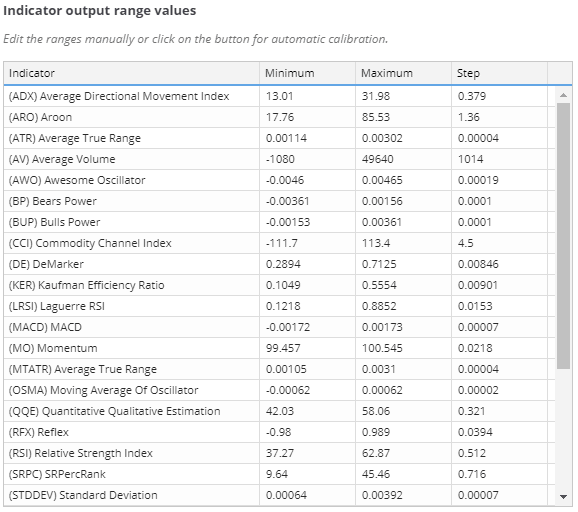
As you can see, the values in the second screenshot are a little more precise. It is up to you if you let the rounding enabled or you disable it.
Was this article helpful? The article was useful The article was not useful
This is really awesome , thank you for this great work !!!!
unfortunately I cant understand the meaning of calibration indicator
Hello,
the whole point is to make the build process more effective so the less computing power is necessary to achieve good results. If you do not do calibration the tester could use indicator ranges and values that are not useful at all
How can RSI with sensible defaults be calculated between 37 and 63 ? I bet there are lots of opportunities on any sample for the RSI to go below 20 or above 80.
This is just saying that given 1) the data they used, and 2) the input parameters of the RSI, then the output values only fell between 37 and 63.
So, if anything looks off, then you’ll have to inspect either 1) the data or 2) the input parameters. For point 2), this article mentions that you can change the input parameters using “tcalibrationSettings.txt” file.