Documentation
Applications
Last updated on 6. 5. 2015 by Mark Fric
Walk-Forward Optimization
Page contents
What is optimization?
The idea behind an optimization is simple. First you have to have a trading system – for example a simple moving average crossover: If EMA(10) crosses above EMA(20) go long, otherwise go short.
In almost every trading system there are some parameters (indicator periods, constants to compare, etc.) that influence the system performance. The optimization means to find the optimal values of these parameters (giving highest profit or best Return/DD ratio or other desired parameter).
For example, would it be better to use rule “EMA(10) crosses above EMA(20)” or rule “EMA(15) crosses above EMA(50)”?
Optimization can help you find the values that returned the best performance in the past.
What is Walk-Forward optimization/analysis?
Walk-Forward optimization is generally a special type of backtest that is composed of multiple smaller backtests on optimizaiton periods. These optimization periods are split over the whole backtesting period and are always followed by Out of Sample tests with the optimized parameters.
It is a technique in which you optimize the parameter values on a past segment of market data, then verify the performance of the system by testing it forward in time on data following the optimization segment, and the process can be repeated over subsequent time segments.
How Walk-Forward optimization works
in walk-forward optimization, the data are divided into a configurable number of periods (5 in this example). Each period consists of optimization part and run part.
The program starts with optimization period 1. It will run the simple optimization on optimization period 1 to find the best parameter values. These parameter values are then applied to run period 1 – strategy is trading with the optimized parameters found in previous step.
At the end of run period 1, the system again runs simple optimization on a part of data marked as optimization period 2. It finds the best set of parameter values and they are again used for trading in run period 2.
This continues until the period 5, which is also the end of history data used in test.
Walk-Forward optimization simulates how you could work with the strategy during real trading – you can optimize it on some historical data and then trade it with the optimal values. After some time you’d want to reoptimize it and let it trade again.
What Walk-Forward optimization/analysis tells you?
It basically tells you if the startegy is robust enough and if its performance can be improved by reoptimization.
If strategy performance is worse during reoptimization than the original non-optimized startegy, it is a big signal to watch for curve fitting.
On the other side, if Walk-Forward optimized strategy performs better than non-optimized version on the same data, it tells you that :
- Your strategy will benefit from optimization, so you should periodically reoptimize it to get the best performance
- It also means that the startegy is robust enough to cope with market changes (using reoptimization) and there is a big chance it will work also in future.
Walk-Forward optimization example in StrategyQuant
Performing Walk-Forward optimization in StrategyQuant is simple, in the next few lines I’ll show the complete process.
Strategy for optimization
For simplicity we’ll use EMA Cross strategy in this example. Note that this strategy in the basic form is NOT profitable, and reoptimiation will not help it, but it is simple enough to demonstrate how optimization works.
You can download the strategy using the link below – Click with right mouse button and choose Save as…
Contents:
- Loading a strategy for optimization
- Setting optimization values
- Configuring walk-forward runs
- Checking the results
- Interpreting the results
- Description of advanced WF score components
Step 1: Loading a strategy for optimization
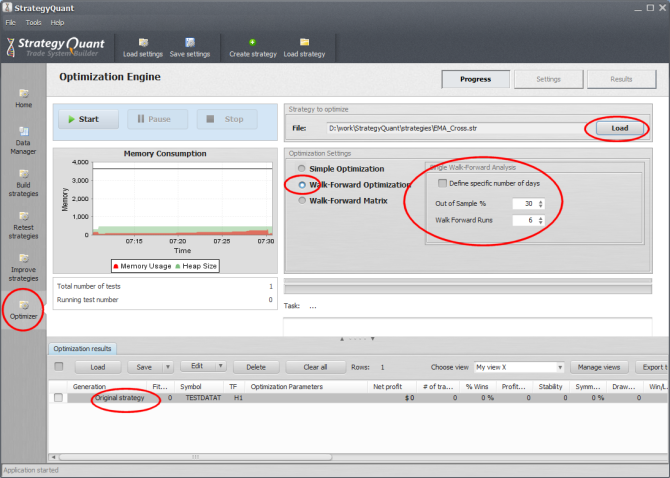
First of all, you have to switch to Optimizer window and load the strategy you want top optimize.
For this example we’ll use simple EMA_Cross strategy that goes long when faster EMA crosses above slower EMA, and go short when faster EMA crosses below slower EMA. After you loaded the strategy, it is added also as Original strategy to the Optimization results databank.
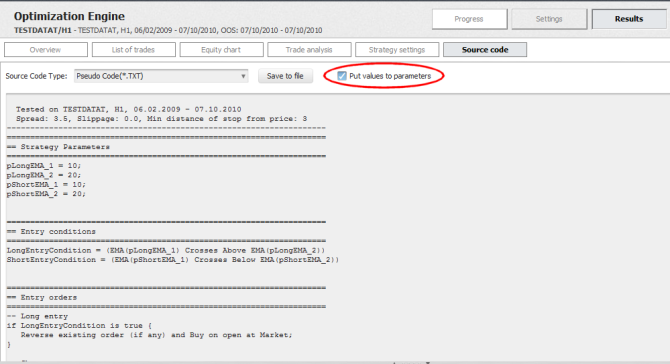
You can double click on the Original strategy and then go to Results -> Source code to see its rules.
Make sure you check the Put values to parameters checkbox so that you see that variables pLongEMA_1, pLongEMA_2, pShortEMA_1, pShortEMA_1 are used to store indicator parameters. In our optimization we’ll try to find optimal values of these parameters.
There’s still one small problem. We can see that the strategy uses different parameters for long and for short direction. We can use it like this if we want to find optimal values independently for long and short side, but for our example we’d like to use the same parameter for long and short side.
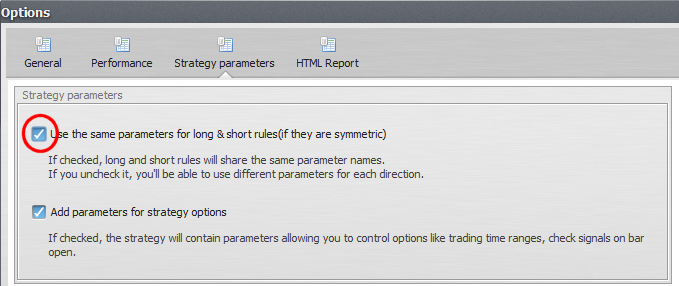
We can do it in program Tools -> Options -> Strategy parameters.
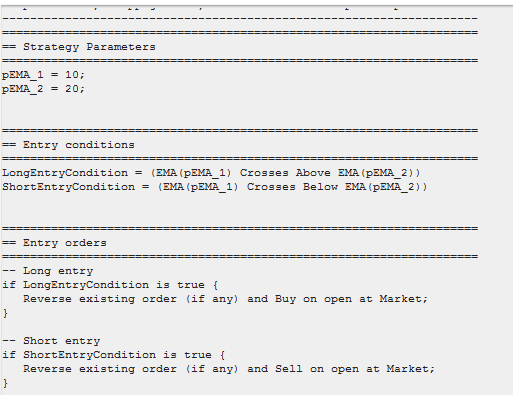
If you check the first checkbox, it will use the same parameters for long and short direction (providing the rules are the same). Click OK to store the settings and refrest the source code.
Step 2: Setting optimization values
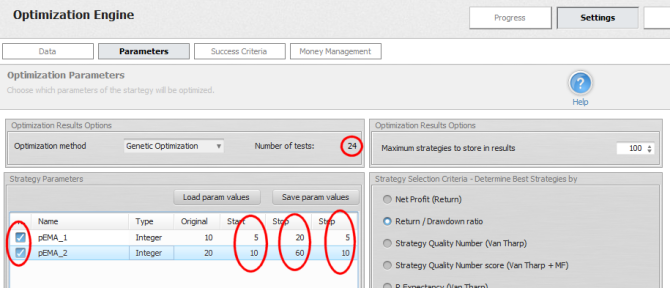
To set up values that will be optimized we have to go to Settings -> Parameters
Here you can see the list of all strategy parameters that are available for optimization. Optimization simply means trying different values of input parameters.
For every parameter you want to optimize you have to check the line of the parameter and choose Start, Stop and Step values. The optimizer will iterate the value from Start to Stop, taking Steps. Original value is also configurable, it will be used to retest the original strategy. You can use this value to compare performance of new results with the “original” settings.
The Number of tests value shows us how many tests have to be performed to test all the combinations of the values.
Note!
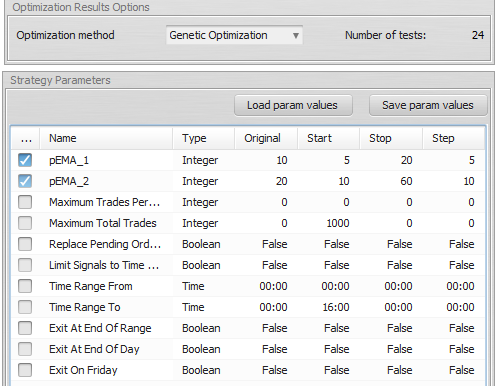
It is possible that your parameters table will contain much more parameters, it could look like this:
This is another powerful feature of StrategyQuant. It allows you to optimize not only strategy parameters, but also other trading options, such as how many trades to take per day, or what should be the time range for trading. These settings are normally a part of Strategy Options, but you can also optimize their values.
If you don’t want to use them and see them in Parameters table, go once again to Tools -> Options -> Strategy parameters and uncheck the checkbox for Add parameters for strategy options.
Step 3: Configuring walk-forward runs
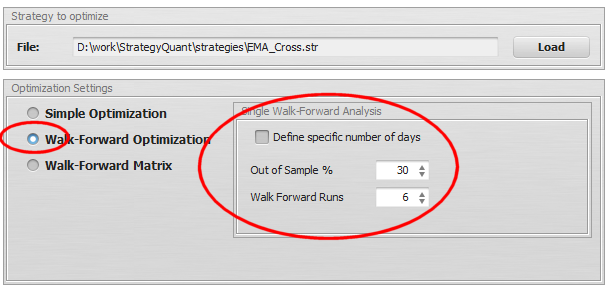
We have to specify also the walk-forward settings. In this example we’ll use 30% Out Of Sample (Run) period and 6 reoptimization steps.
Out of Sample %
this means how much of the whole period is left for run. If we’ll set it to 30 %, it means that in each period 70% of the data are used for optimization, and 30% will be used for trading using the optimized values.
Walk Forward Runs
this means how many optimization runs there will be, which means how many times we’ll reoptimize the strategy.
It is also possible to specify the optimization (In Sample) and run (Out of Sample) periods by exact days, you can do it by checking Define specific number of days.
Step 4: Checking the results
Walk-Forward optimization takes longer than a simple one, because there a 6 (or more) optimization steps instead of just one.
When it finishes, we’ll see that we have only two results in the databank – Original strategy and Walk-Forward result.
When we’ll double click on the result in the databank, the strategy results will open.
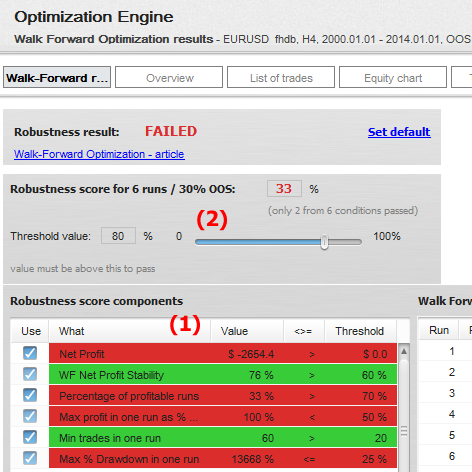
We can see that the strategy failed in walk-forward test, based on our robustness score settings.
Robustness score is fully customizable. We can set all the conditions we want to watch in the Robustness score components table (1) and set their boundary values.
The main Robustness score threshold value (2) means how many of these scores used must pass in order for WF result to be considered successful.
On the right from this table we can check the results for each optimization and run period:
You can see that only 2 out of 6 runs ended up in profit.
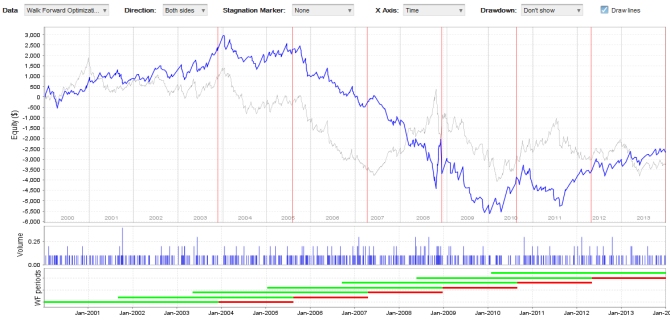
We can also check the equity chart:
Blue line represents reoptimized strategy, while thinner gray line represents original non-optimized strategy.
Interpreting the results
How should we interpret these results?
First of all, it is clear this particular strategy doesn’t have better result when reoptimization is used.
Surely this strategy isn’t profitable in its original form and it WASN’T MADE PROFITABLE BY REOPTIMALIZATION.
But what if we’d reoptimize the strategy more often? Or if we’ll use different Out of Sample %? How can we tell what is the best reoptimization period for strategy?
This is where Walk-Forward Matrix comes to play – check the next article.
Tip – check also article Description of advanced Walk-Forward values for description of various values you can be used in filters or shown in databank.
Was this article helpful? The article was useful The article was not useful




Hello. Could you explain me why the results of before and after walk-forward test are same? Number of trade, list of trades, winning percent so on everything.