Documentation
Applications
Last updated on 26. 2. 2019 by Kornel Mazur
Settings – Ranking
Page contents
When the strategies are generated, every new strategy is backtested on a history data and the results of the backtest are then used to compute the Fitness (rank) of the strategy.
Fitness is number from 0 to 1 and it should reflect the “quality” of the strategy according to the given criteria.
In this screen you can configure how this Fitness value is computed (Strategy Selection criteria), how many top strategies are stored in the databank and which strategies are stored to databank and which are thrown away (Custom conditions).
Databank Options
The best strategies found are continually stored into the Databank.
It is not possible to store every strategy (remember that StrategyQuant can create thousands of new strategies every hour) so we must specify how many strategies should be stored in the databank, how they should be sorted to find out the best ones and which strategies should be thrown away.
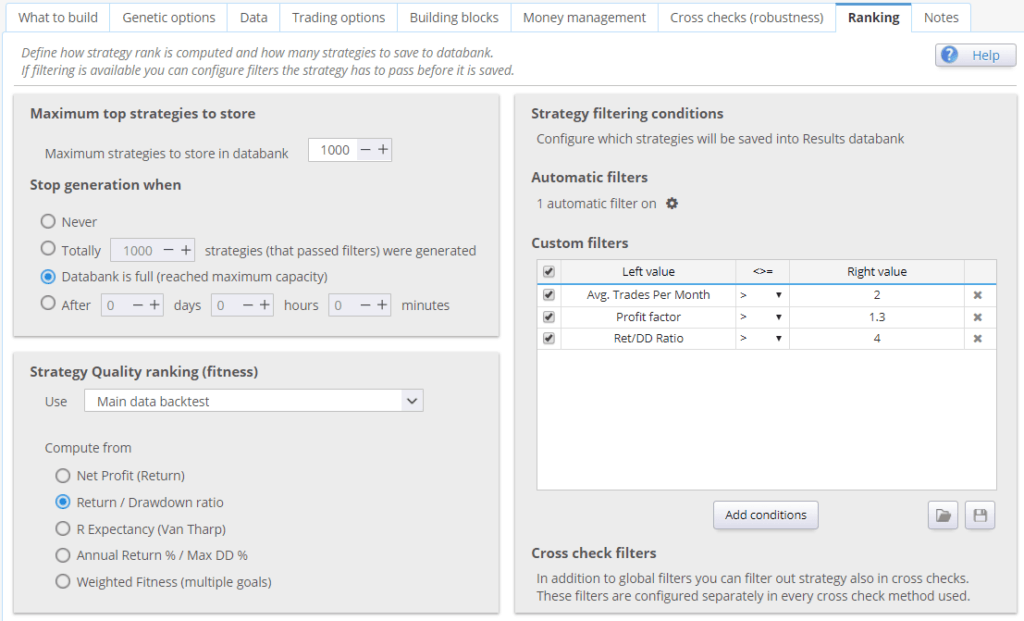
Maximum Strategies to Store in Databank
simply the maximum number of strategies remembered in the program
Stop generation when
allows you to define whether the generation process will be terminated when databanks if full or will continue until stopped manually.
Strategy Quality ranking (fitness)
Here you can choose from which data the strategy criteria will be computed and what criteria should be used to compute the total Fitness of the strategy.
Use (main data backtest / cross checks):
You can select if you want to compute fitness (strategy fitness score) from main data or from portfolio (if you use also additional data).
It is generally recommended to use Portfolio, then the strategy fitness will be computed from the sum of all trades across all the symbols in your portfolio.
If you use this setting and you don’t have any additional data, fitness will be automatically computed from main data.
Determine best strategies by
You can choose from the predefined most used criteria, or you can build your own complex fitness function based on multiple criteria, each with a different weight.
Note that if you choose to combine too many criteria, they might “fight” against each other without achieving what you expected. Profit Factor
criterion to maximize Profit Factor of a strategy.
Strategy filtering conditions
you can define conditions to throw away strategies with bad properties. For example it usually makes sense to throw away strategies that result in loss or these that have too little number of trades.
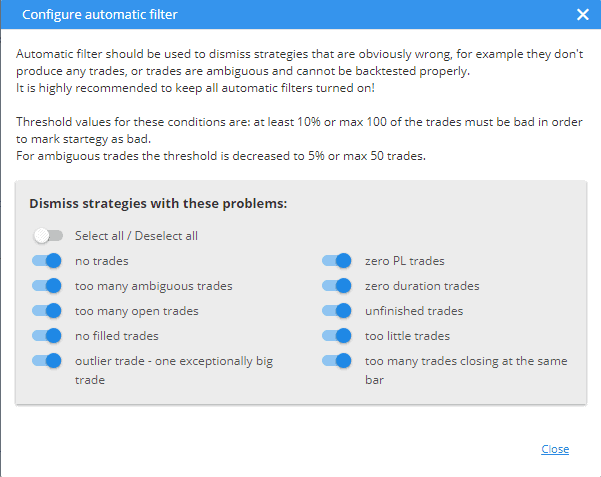
Automatic filters
automatic filters should be used to dismiss strategies that are obviously wrong such as 0 trades strategies, strategies having no profit or strategies which have no filled orders. All the available options can be seen below.
Custom filters
allow you to specify your own custom rules that will be evaluated for every strategy.
If the strategy matches any of the rules, it will be dismissed.
This is useful to quickly dismissing strategies that result in loss or with too little number of trades.
There are separate values for In Sample and Out of Sample performance, and for Robustness Tests (if used) or Portfolio (if you used additional data).
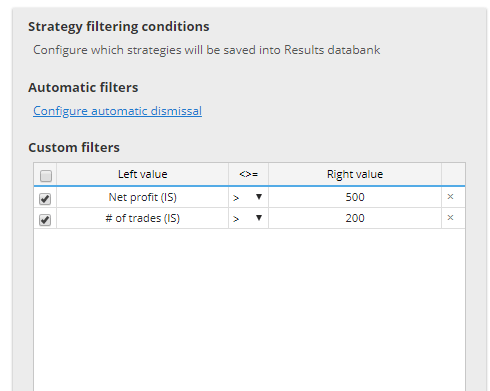
The abbreviations used in custom conditions are:
- IS (In Sample) – result of In Sample part of data
- OOS (Out of Sample) – result of Out of Sample part of data
- RT (Robustness Tests) – result of robustness tests
- P (Portfolio) – results for portfolio (if exists)
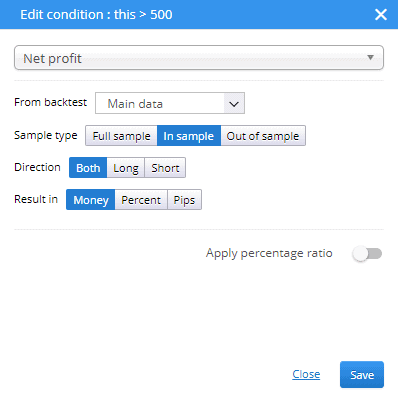
Results can be evaluated using Money, Percent or Pips values for either long, short or both directions.
Was this article helpful? The article was useful The article was not useful
Can you explain why when I have “Annual % Return % > 45%” in Ranking-Strategy Filtering Conditions-Custom Filters, why is it that strategies of less than 45% are not eliminated?
What “unit” do you use for the metric? If you want to keep the number unchanged and prevent converting to “percent” keep using the “money” unit even for metric like Annual % return. Bit tricky but should help
A) I’m building strategies on a EURUSD H1 timeframe using the EURUSD_M1, downloaded as M1 data, with precision on the selected timeframe and a custom spread/slippage/swap. B) After that I retest all these generated strategies on timeframe H1 to EURUSD, downloaded as tick data, using the real tick-custom spread (same settings) My ranking parameters on automatic filters and the custom filters are identical for building (A) and retesting (B). How come less than 1% of my build strategies (A) are success when retesting them (B) on all the same parameters, but only with real tickdata as the difference. Most failures… Read more »