Documentation
Applications
Last updated on 18. 3. 2024 by Mark Fric
New Benchmarking feature
StrategyQuant X Build 139 adds a new visual benchmarking feature that allows you to compare your strategy with a standard benchmark – with S&P 500 index.
Benchmark is available in equity chart, here’s how standard equity chart looks like:

You can turn the benchmark on using the new Benchmark menu – see below:
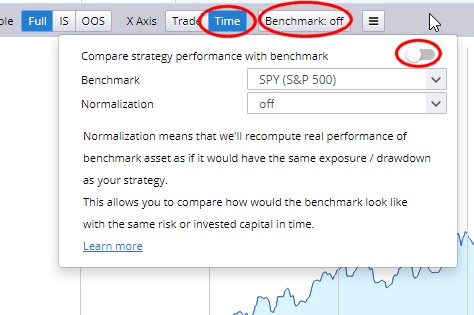
Please also note that the chart X Axis must be set to Time.
There are a few other options in this dialog that we’ll explain later.
When you turn on the benchmark your equity chart changes:
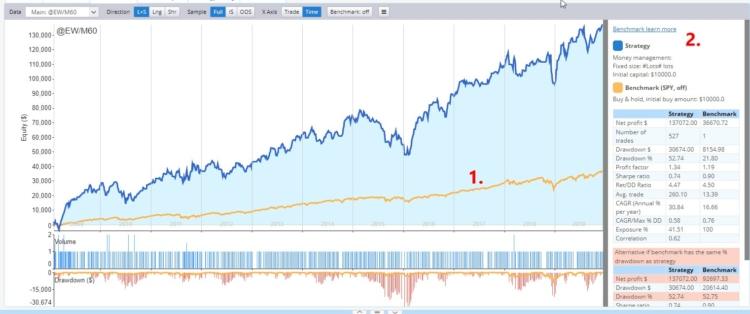
There are two new things:
- A yellow line displaying benchmark equity
- A table showing the most important metrics for both your strategy and benchmark.
Benchmark is computed by investing your defined initial capital – for example $10 000 into S&P index (SPY ETF) and holding it the whole time your strategy trades.
You can see at the first glance that strategy performs better than the benchmark. What is not so obvious is that while this is true, strategy drawdown (in both $ and % terms) is bigger than DD of the benchmark.
Strategy Max % DD is 52.74%, while strategy of buy and hold SPY has Max % DD only 21.80%.
This means that your strategy has bigger gains, but also bigger risk.
Risk and drawdown can be influenced by money management – you can use the settings that will trade your strategy with lower risk.
Luckily for you, there is a tool for quick & dirty comparison of performance that “simulates” the case of strategy and benchmark having a few important selected metrics equal – we call it normalization.
Normalization is basically only a recomputation of the initial capital used for buy & hold benchmark strategy, so that the result matches one of the important metrics of your strategy.
There are 4 normalizations available:
- Normalize by $ drawdown – computes initial capital for benchmark so that Max Drawdown is as same as in strategy
- Normalize by % drawdown – computes initial capital for benchmark so that Max % Drawdown is as same as in strategy
- Normalize by Money management – computes initial capital from MM set by the strategy
- Normalize by exposure – computes initial capital for benchmark so that exposure (% of time the strategy is in trade) is the same as in strategy. This is useful when benchmarking seasonal strategies that trade only occasionally.
Most times you’ll be probably most interested in Normalize by % drawdown – to compare what the performance would be if the benchmark has the same % drawdown as your strategy.
If we’ll turn this normalization on we’ll see this result:
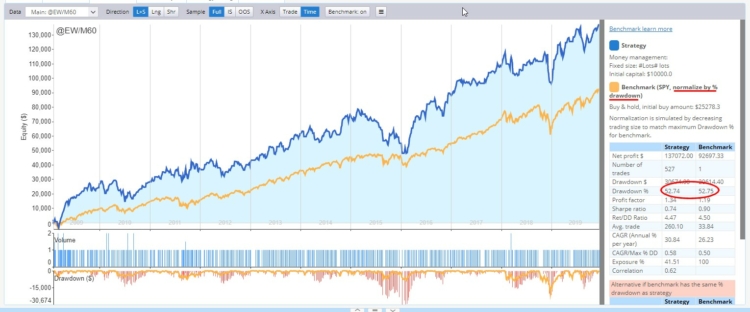
The table on the right tells us what was done – Buy & Hold benchmark strategy was recomputed to start with initial capital of $25278 USD, in order to achieve the same % drawdown as our strategy 52 % in both cases.
We can see that the benchmark equity went higher, but it did not surpass the strategy performance – this means that the strategy in general performs better than benchmark, if we consider both risk and the profit.
There is also an “alternative” table that shows you exactly this – no matter if you use normalization or not:

The result will also give you thumbs up or down, depending on how your strategy performance is holding against the benchmark.
Please note that the result evaluates only Net profit in $ against the same risk defined by Drawdown %, so it is a very simplified view meant only to give a rough estimation.
This was a quick introduction to a new benchmark feature in SQX 139. It is the first version of this feature, and you are welcome to experiment with it and share your findings with us.
Was this article helpful? The article was useful The article was not useful
excellent ! Thank you
will we be able to compare with other benchmarks?
yes, it is planned for later. For now only with SPY
great, and as mentioned, benchmarks would be helpful. second most important is probably btc. anyways, this is a solid foundation! thank you.