Documentation
Applications
Last updated on 22. 5. 2020 by Mark Fric
Results – Equity chart
Displays equity chart of the strategy.
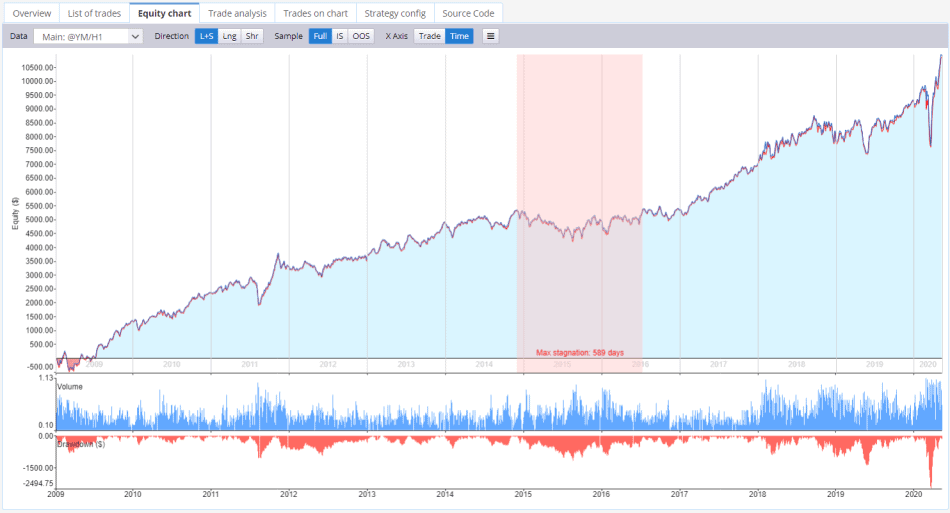
Stagnation marker shows the maximum stagnation period – this is the longest period that it took strategy to make new high on the equity.
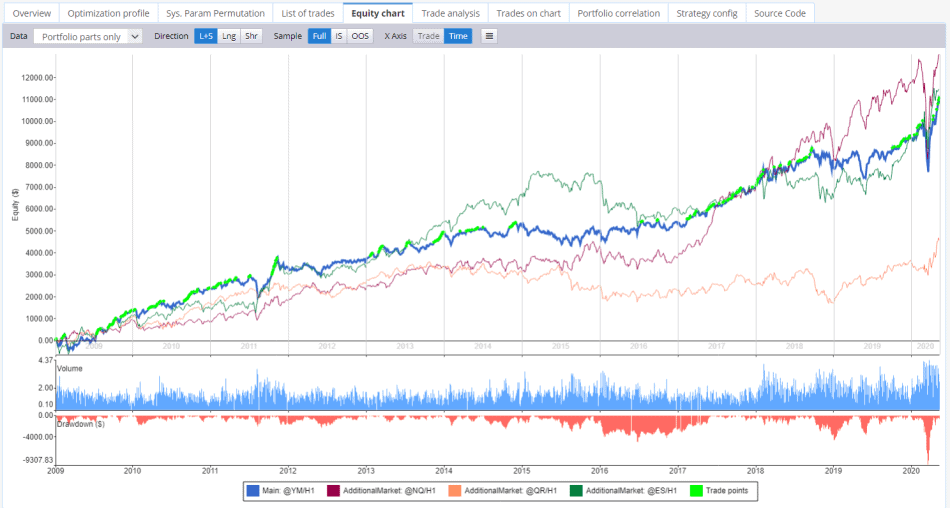
In case of portfolio, it displays charts for every symbol/timeframe tested, plus equity of complete portfolio.
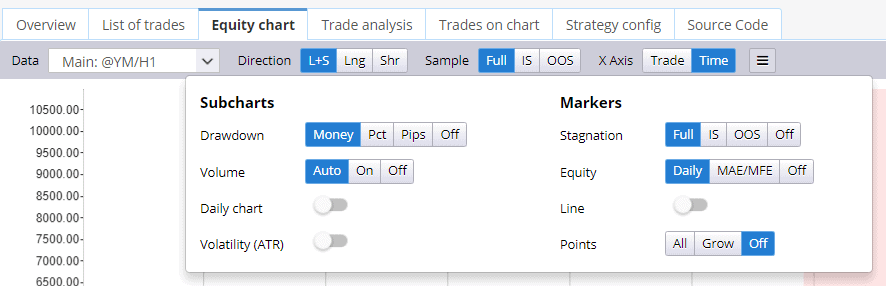
There are multiple other options you can turn on to see in equity chart, for example displaying also Daily equity or MAE / MFE lines
When you use Backtest on additional markets cross check to test the strategy on more markets then results for all the backtests are added to the strategy and you can switch between them, or display all equity curves at once:
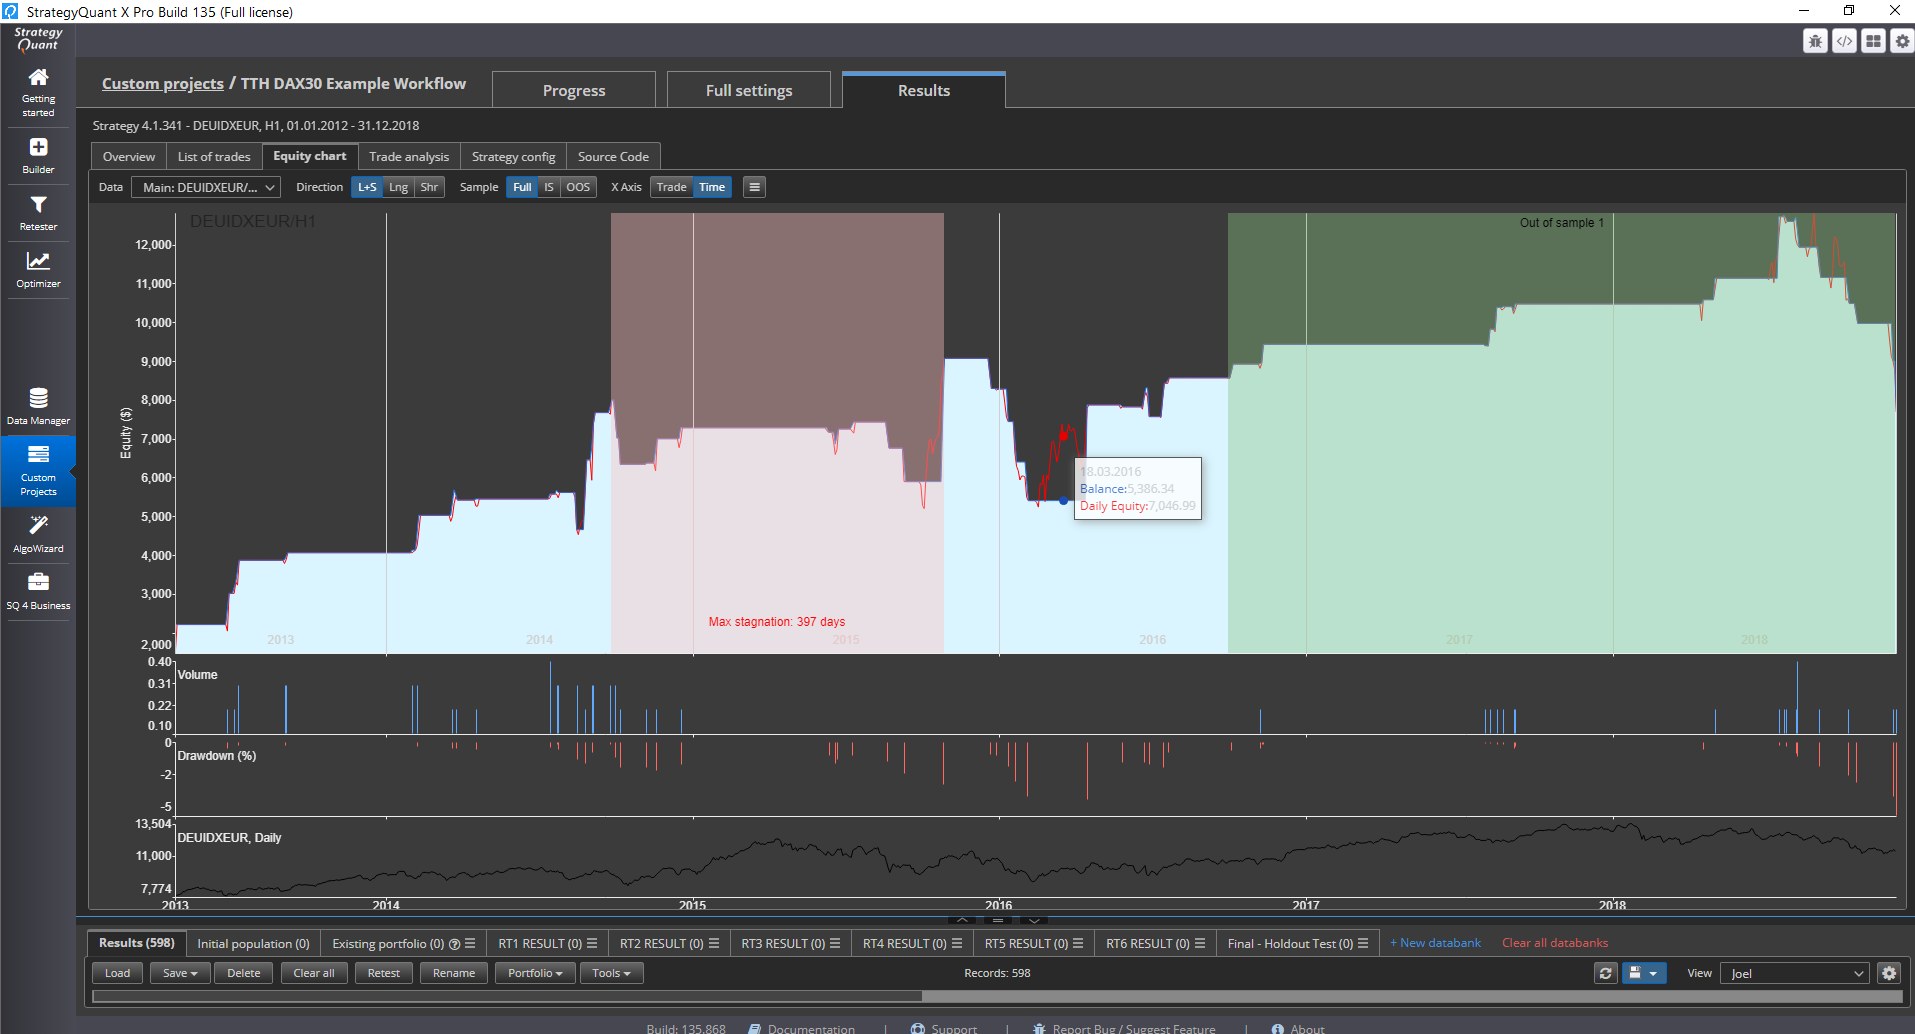
Daily equity and Balance.
The difference between these concepts is simple.
Balance is calculated from closed positions. Equity is the balance + open positions.
Was this article helpful? The article was useful The article was not useful