Documentation
Applications
Last updated on 16. 11. 2018 by Mark Fric
Optimization Profile and System Parameter Permutation in StrategyQuant
Page contents
This article will be about two important new features that were added to StrategyQuant X Build 114.
They are related to each other, and they both are trying to answer the most important questions when creating new trading strategy:
- Does my new strategy have any real edge?
- Can I expect it to work on unknown data / in the future?
Both these methods are based on performing and evaluating strategy optimization – this means that you must optimize strategy parameters first, and then apply one or both methods to evaluate the results of all optimization runs.
Optimization Profile
is described in the video from Robert Pardo available here: https://www.buildingrobuststrategiesmasterclass.com/overcome-curve-fitting
Please watch it to get a complete understanding of this technique.
The idea of Optimization Profile is simple – after the optimization of strategy parameters we make and evaluate a “profile” of all optimization runs.
There are 5 basic things to look for in the optimization profile:
- How big portion of all optimization runs is positive – the logic behind this is that strategy should perform under wide range of parameters
- Average profit for all optimizations should be above zero – similar to previous point
- The distribution of all profits is as uniform as possible – meaning that it doesn’t skip from positive to negative with every optimization
- Top optimization shouldn’t be too big (within 1 standard deviation) compared to the average optimization result – so that the results weren’t distorted by just one run with exceptional performance
- The shape of optimization landscape on 3D chart should be “stable” – this can be checked only visually
How Optimization Profile is implemented in StrategyQuant X
The best thing is that you don’t need to do anything – Optimization profile is created and saved for every optimization you run – so if you are running simple or Walk-Forward optimization, StrategyQuant will create an optimization profile for your optimization that you can evaluate.
Checking Optimization profile in Results
If strategy contains Optimization profile, a new tab “Optimization profile” will be visible in Results.
There you can see panels for all the properties that should be evaluated according to the optimization profile rules.
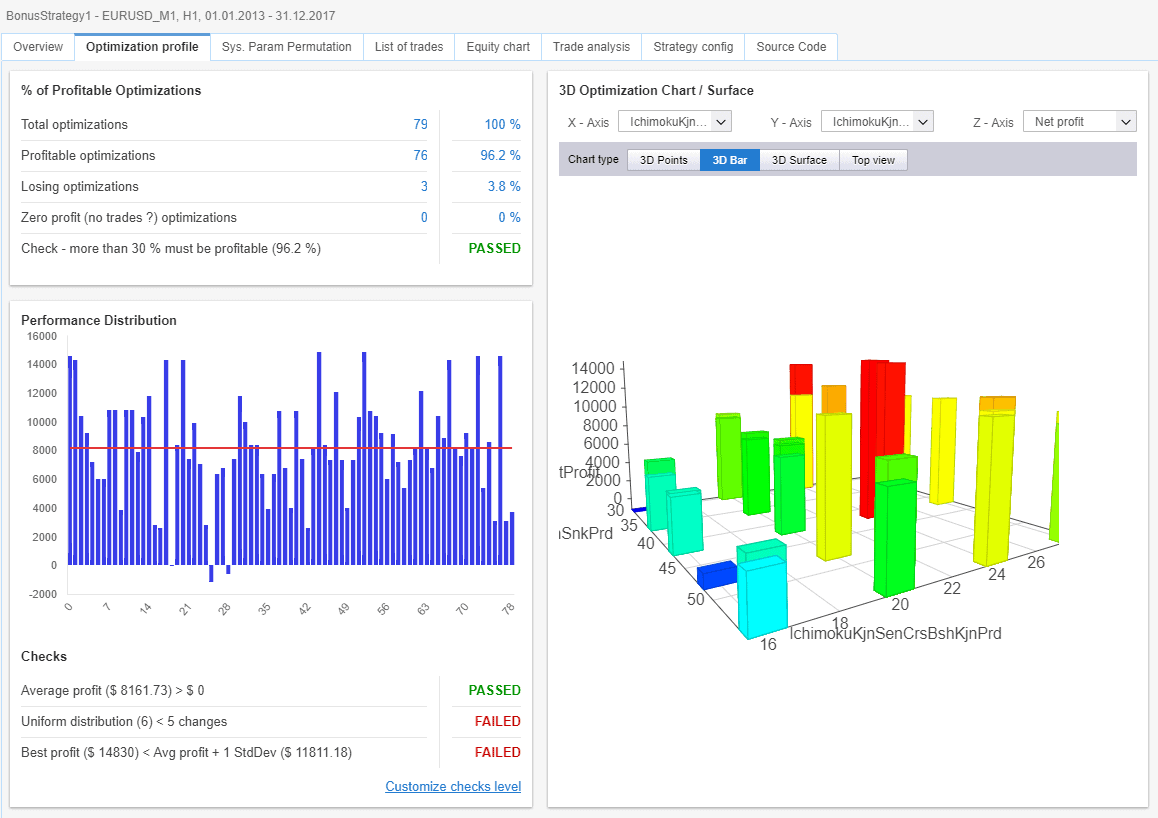
First panel displays the numbers and percentages od profitable and losing optimizations, and the first check that evaluates point 1. in the previous list.
Second panel displays histogram of Net profit for all optimization runs. Every bar represents Net profit achieved in this optimization, and the red line shows average Net profit for all the runs.
Below the chart are three checks that evaluate points 2. to 4. in the previous list.
Third panel on the right displays 3D optimization chart in one of four possible styles. You can choose the parameters that are on X and Y axis, as well as what value is displayed on Z axis.
Using Optimization Profile in cross check
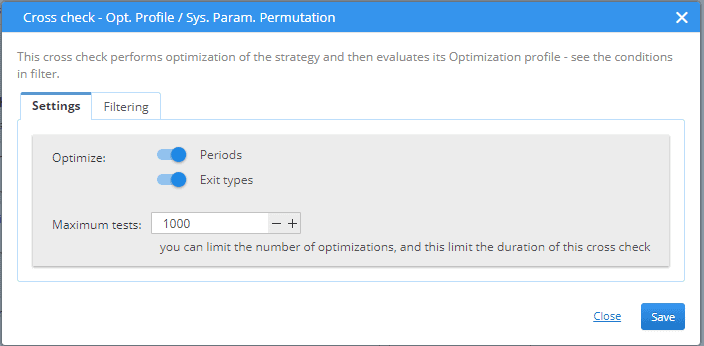
New crosscheck named Opt. Profile / Sys. Param. Permutation was added to the system and you can activate it in cross checks section of the settings.
It has a simple configuration – you only choose only type of parameters should be optimized and maximum number of different optimizations to run.
Then in Filtering, you can configure the FAIL/PASS conditions – what should be the conditions of the optimization profile for strategy to pass this check.

You can turn the particular check on / off and set the limit boundary for every check.
System Parameter Permutation (SPP)
this method was originally described by Dave Walton of StatisTrade, and is available in the paper here: http://papers.ssrn.com/sol3/papers.cfm?abstract_id=2423187
Again, please read the original paper for complete understanding.
The idea behind it (in very simplified terms) is that from the strategy in its current stare, with its current parameter values we cannot determine if the strategy has any edge. If strategy was created by data mining (as it was in StrategyQuant X) then its parameters could have been randomly selected so that their values more or less fit to the historical data and make strategy more or less profitable.
The idea behind System Parameter Permutation is that we must test ALL the possible parameter combinations (i.e. optimize strategy with all possible combinations), and only from the data of all optimization runs we can make some assumptions about the realistic strategy performance.
The important information that SPP computes are Median values for every strategy performance statistics – Net profit, Drawdown, % Drawdown, Sharpe ratio, and so on. So, we can see Median Net profit, Median Drawdown and so on.
These median values are what we can consider (according to the paper) to be the realistic estimation of real strategy performance on given data.
The usage is simple – instead of Net profit of backtest on the main data you should consider Median Net profit computed using SPP.
Checking System Parameter Permutation in Results
If strategy contains SPP data, a new tab “Sys. Param. Permutation” will be visible in Results.
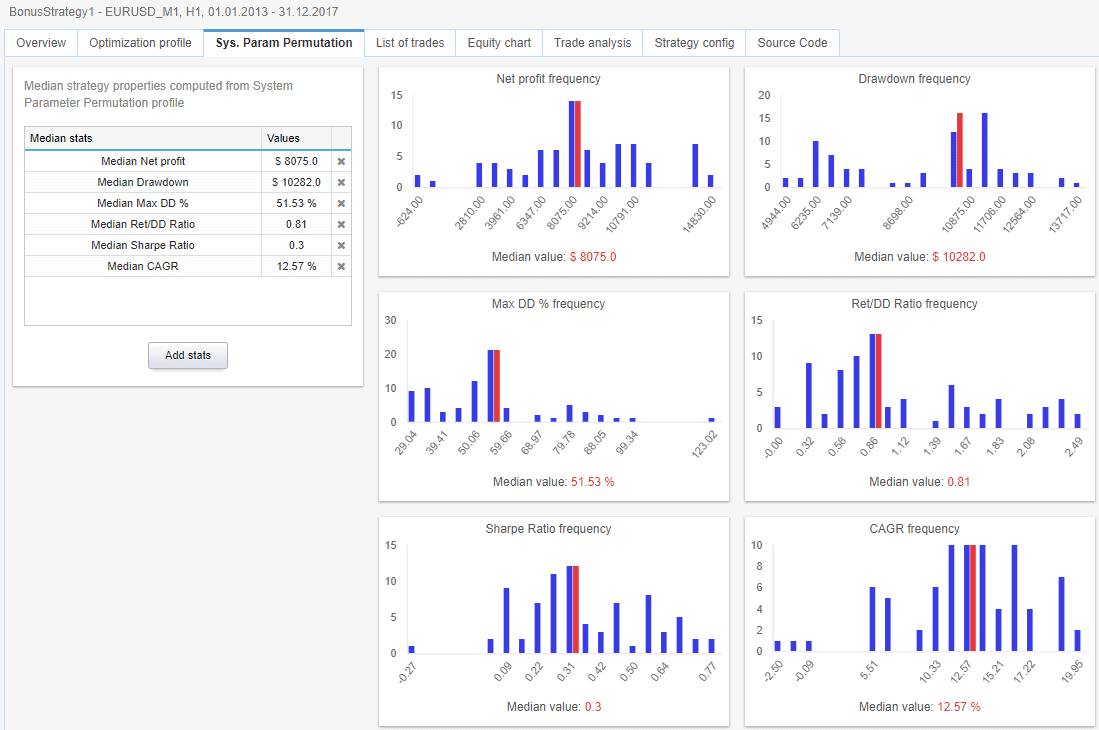
It is very simple – on the left there is a table that shows Median values for all the stats computed from the backtest by applying SPP method on the optimization results.
On the right are charts that show frequency and on the right are configurable charts that display count histograms, with median values for configured values.
Using System Parameter Permutation in cross check
SPP is used in the new cross check named Opt. Profile / Sys. Param. Permutation.
The configuration of this cross check was already described in the Optimization profile section.
The filtering part allows you to check for Median values of all standard columns – for example Median Net profit and Median Drawdown.
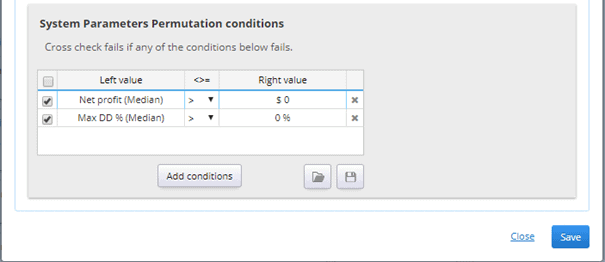
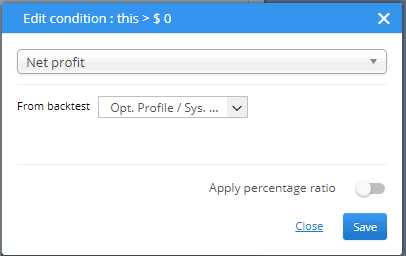
To use Median values in the filters you must first choose the columns you want to see, and then edit each of them by double-click and choose “Opt. Profile / Sys. Param. Permutaiton” crosscheck as value in From backtest field.
This will make the column from System Parameter Permutation cross check, which computes Median value of the original column.
Displaying Median values in databank
Median values computed from SPP can be displayed also in databank – in the same way as in the filter as described above. Just click on Manage view, add some new column, switch its From backtest to “Opt. Profile / Sys. Param. Permutation” and you’ll see its median values in the databank.
Note that these values will be computed displayed only if this cross check was active and if there was an optimization profile computed for the strategy.
Important note about Maximum tests and possible parameter combinations
Both methods work with the assumption that ALL possible combinations of strategy parameters are tested. This is possible if your strategy has just 2 or 3 configurable parameters.
It is in fact highly recommended for your strategy to have as little configurable parameters (degrees of freedom) as possible.
In reality however, trading strategy usually has more parameters, and the number of all their possible combinations can go from thousands to billions or even trillions.
It is not feasible or even possible to test all these combinations.
In StrategyQuant X we solved it by limiting maximum number of optimization tests – this is the Maximum tests number you can set in optimization settings. Once this limit is reached, optimization will stop.
Limiting the number of tests is the only realistic approach, but be aware of this limit and its impact.
If the number of all possible parameter combinations is much bigger than this limit, you’ll be evaluating only a small subset of all possible strategy variations, which also somehow limits the information you’ll get by applying Optimization profile or SPP method.
There are some more advanced methods to address this issue, and we will be adding them to StrategyQuant in the future, so stay tuned for more.
Was this article helpful? The article was useful The article was not useful
I think if the performance distribution was an normal distribution.
The top optimization is difficult to small than the average optimization result + 1 stddev, am I right?
Steve, you can provide an example to support@Kevin.com
We can discuss more details
Hello, I´m making a deeper study about SPP, SQ only screens the graphical results of the SPP, It could be better to have all the sample distribution to have a deeper knowledge about the results distribution and make the optimal statistical inference.
Is it possible to export-extract the SPP results in CSV or similar format? How?
Thank you, Juanjo.
Unfortunately not possible to do now but we could add this feature into future versions
One point that I coudn’t find in any places is: How can I update/change the strategy parameters to the one on closest to the Median results? What I’m trying to bring to this thread is the fact that SQX can find the median values using the SPP, but it doesn’t update the strategy to use these parameters, so we can just only see the median value but we can’t use it. It is been frustrating to me cuz i’m find some very nice strategies but when using it on Portfolio Master we can NOT assume that the results be confidence… Read more »
i guess one could go and rebuild the strategy in algowizard and set the parameters at the median results? seems cumbersome / manual however…
That’s the main problem: we don’t know these params to set manually on the strategy. We just see the median results but we can’t see the “median” parameters that cause these mediam results.
I get what you mean—you want to set the strategy to the stable area near the median results. That’s basically what sequential optimization is for. But just to clarify, the median values come from lots of different tests, so they’re not a single set of parameters you can just apply.
Since the median is a summary of many runs, there’s no one parameter combo that matches all median values at once. So SQX doesn’t update the strategy automatically to those median numbers.
the Robert Pardo link above is broken, is there another recommended source or explanation to help understand the theory behind the optimization profile test?