Documentation
Applications
Last updated on 14. 4. 2026 by Tomas Vanek
Results Plugins
Page contents
Building Custom Results Plugins with Claude Code
A step-by-step guide to extending StrategyQuant X using AI-assisted development
Introduction
Starting with StrategyQuant X build 144, custom Results plugins can be built through AI-assisted vibecoding using the Claude Code desktop app. StrategyQuant X has always supported custom Results plugins as static HTML files loaded into the Results tab — but building one was complicated and out of reach for most users, requiring solid JavaScript skills, knowledge of the PostMessage API, the SQX data model, and CSS theming.
From build 144 onward, that changes. You can now build full-featured plugins by describing what you want in plain English. Claude reads the SQX plugin guide that ships with your installation, understands the conventions used by existing plugins, and generates production-quality code you can drop straight into your Results tab.
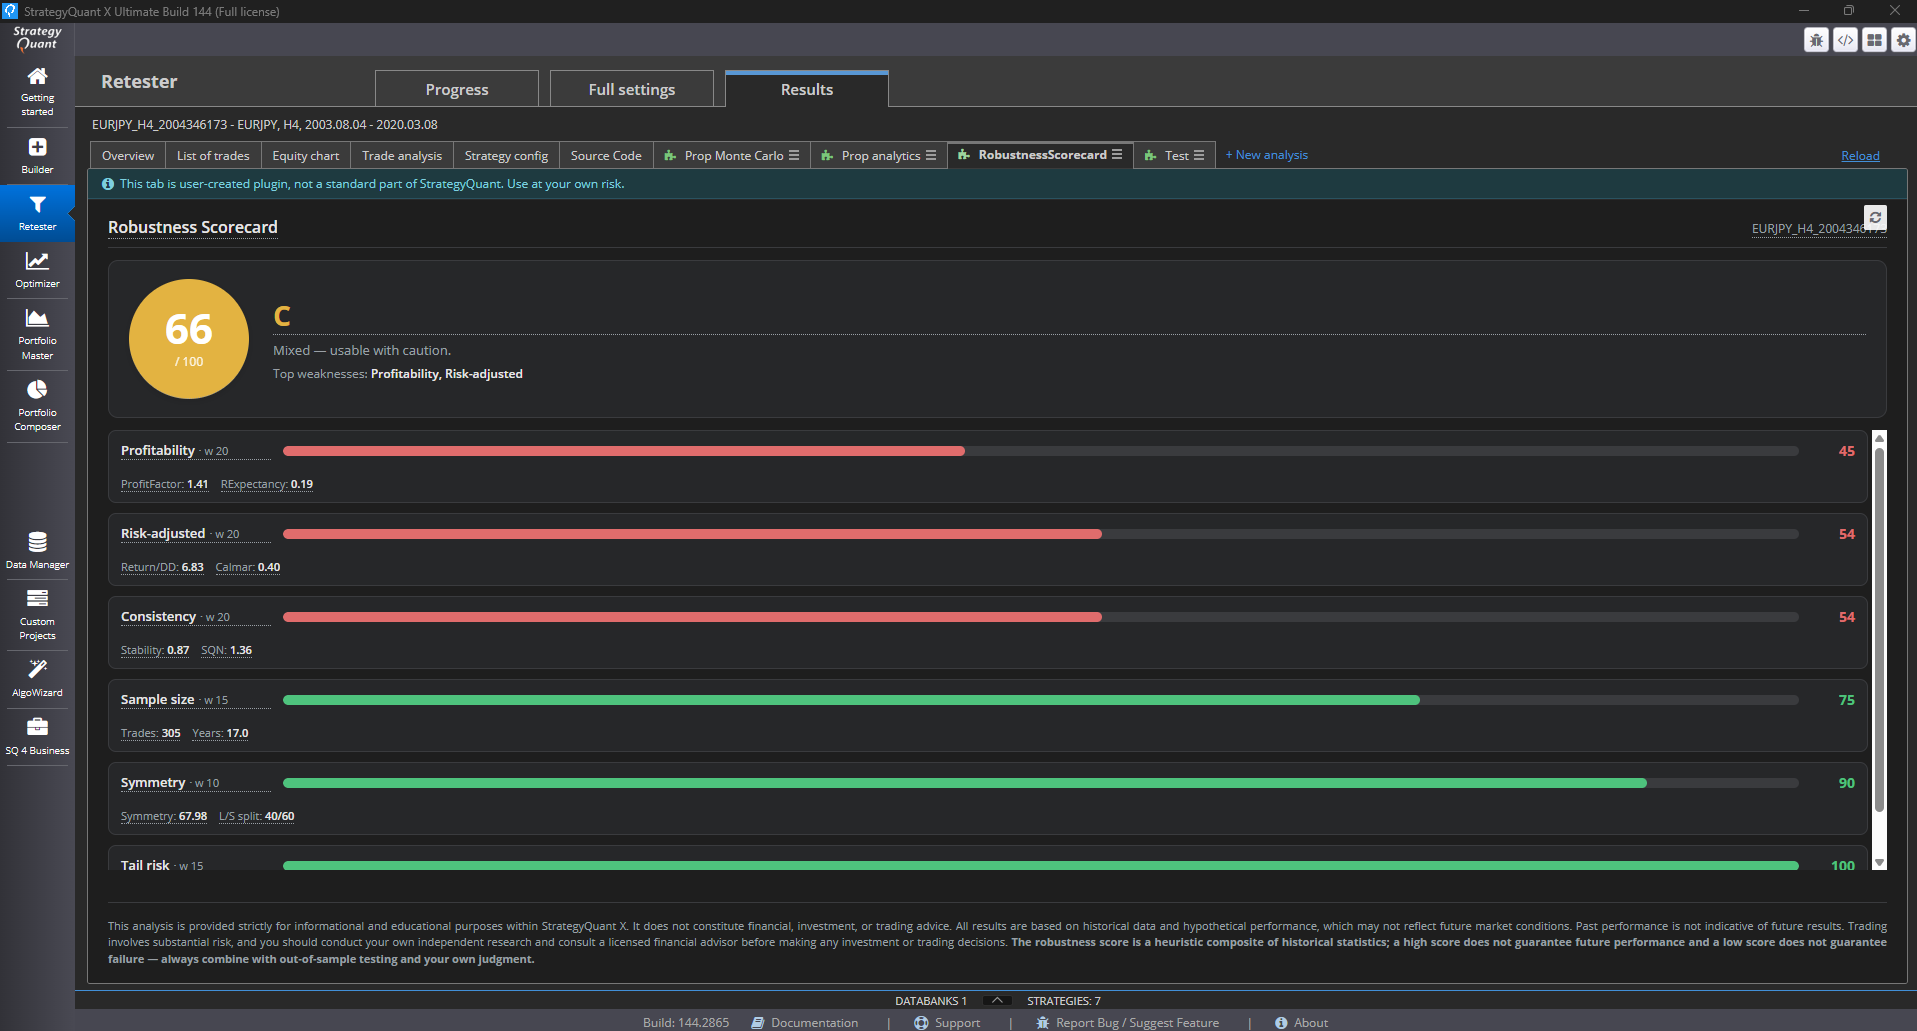
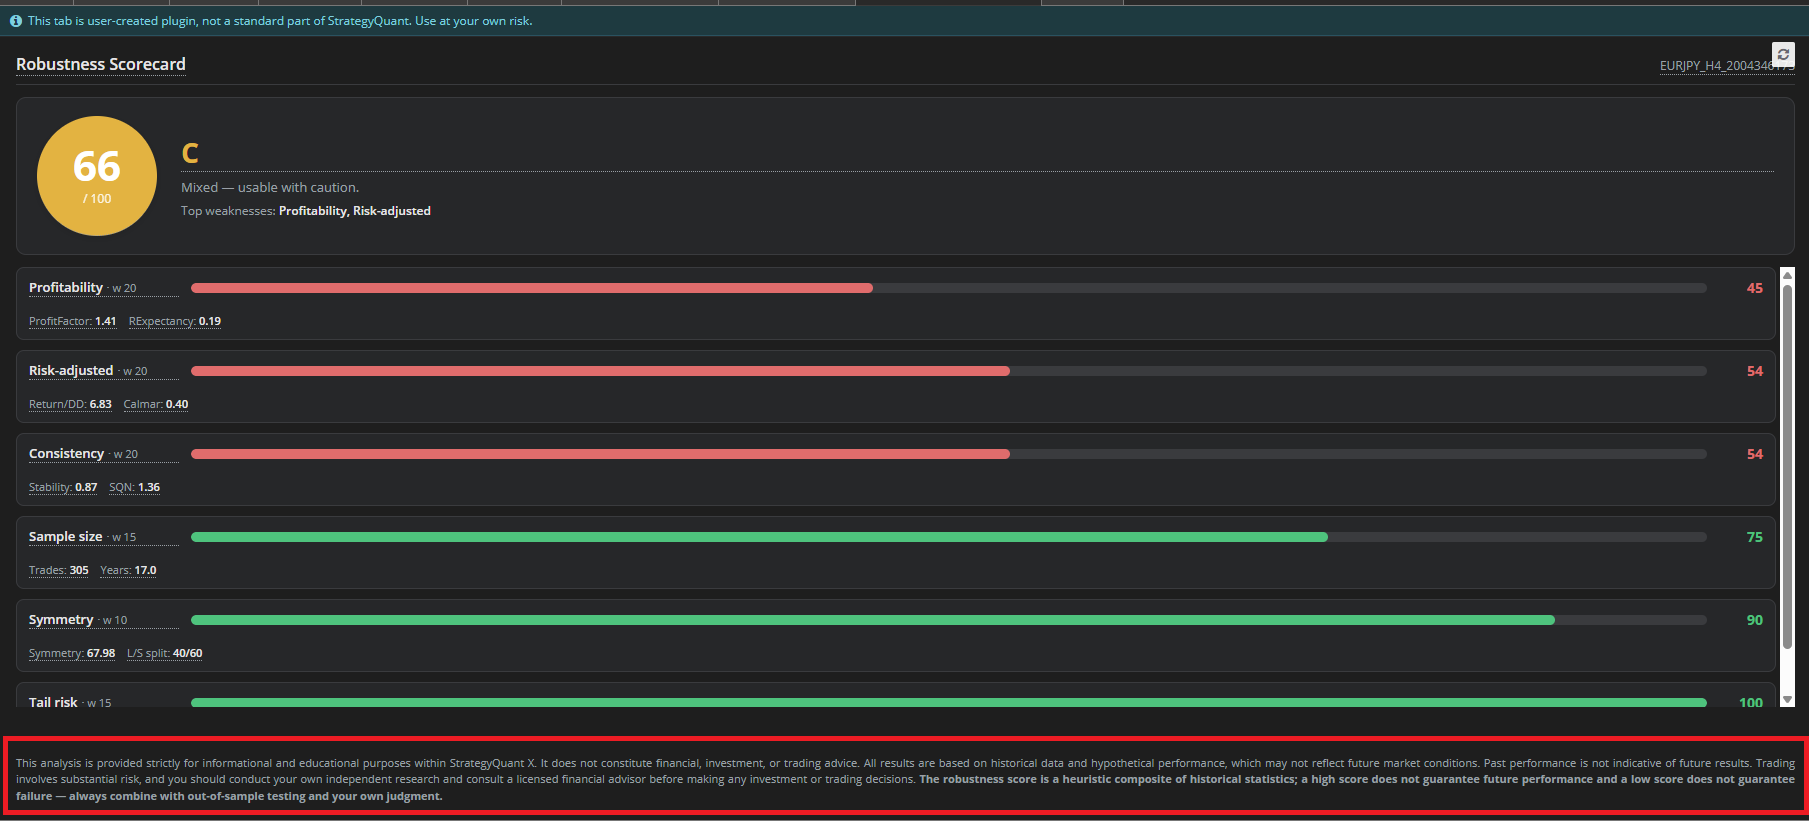
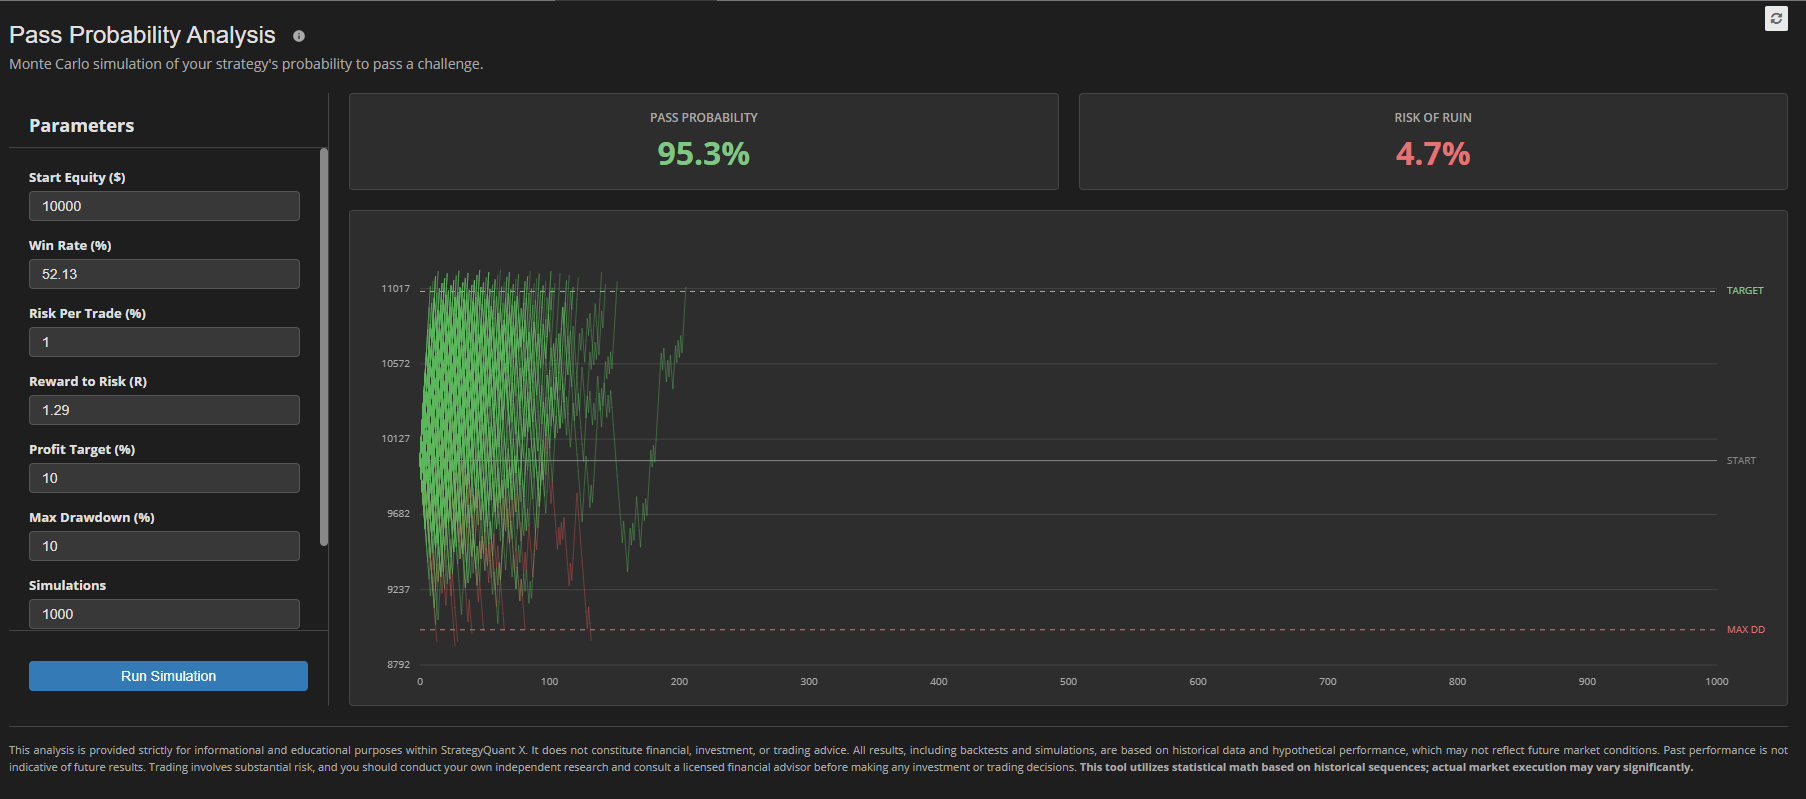
This guide walks you through the complete process of building a real plugin — the Robustness Scorecard, which rates any strategy from 0 to 100 across six robustness pillars. Every step is something you can reproduce in your own Claude Code session. Scorecard is available for download here:
[Screenshot: The finished Robustness Scorecard plugin running inside the SQX Results tab, showing the score circle, letter grade, and pillar bars.]
Prerequisites
Before you start, make sure you have:
- StrategyQuant X installed — Pro or Ultimate license (the Starter tier does not support custom plugins)
- Claude Code desktop app installed from claude.com/claude-code
- A basic understanding of where
user/extend/ResultsPlugins/ lives in your SQX installation - At least one backtested strategy available in a Databank to test against
No JavaScript, Vue, or CSS knowledge is required.
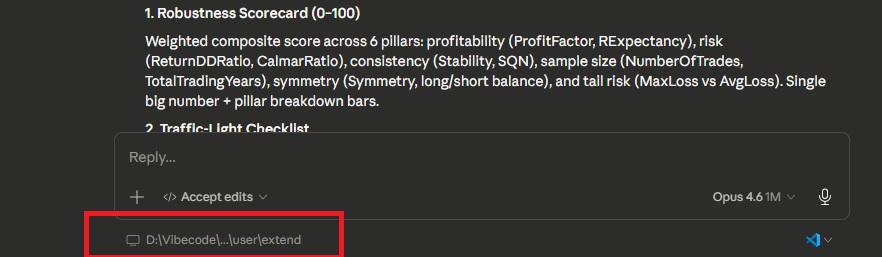
Step 1 — Open the plugins folder in Claude Code
Launch the Claude Code desktop app and open the user/extend/ResultsPlugins/ folder from your SQX installation (File → Open Folder, or drag the folder onto the app icon).
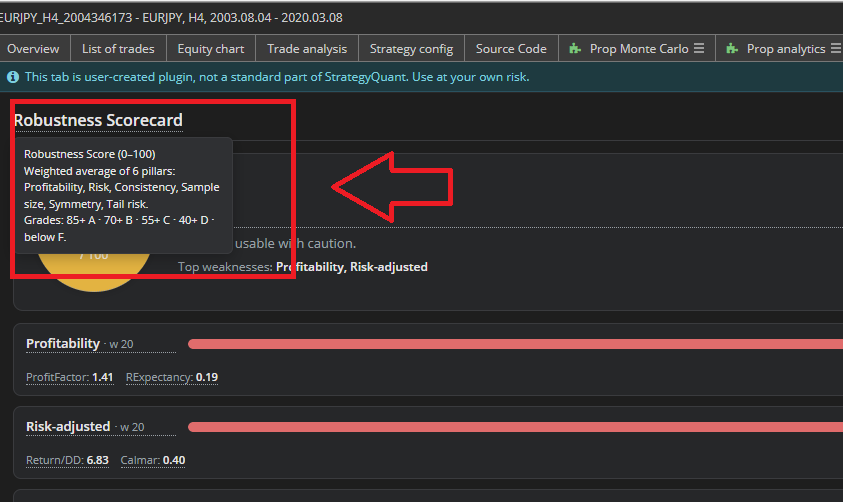
When the folder opens, Claude Code automatically picks up the CLAUDE.md file maintained by the SQX team. That file contains the full plugin architecture, the complete PostMessage API, the list of available stats fields, theming rules, disclaimer requirements, and tooltip patterns. From this moment on, Claude knows everything it needs to build a plugin that fits in naturally alongside the official ones.
[Screenshot: Claude Code window with the ResultsPlugins folder open in the Claude Code.]
Step 2 — Let Claude scan the environment
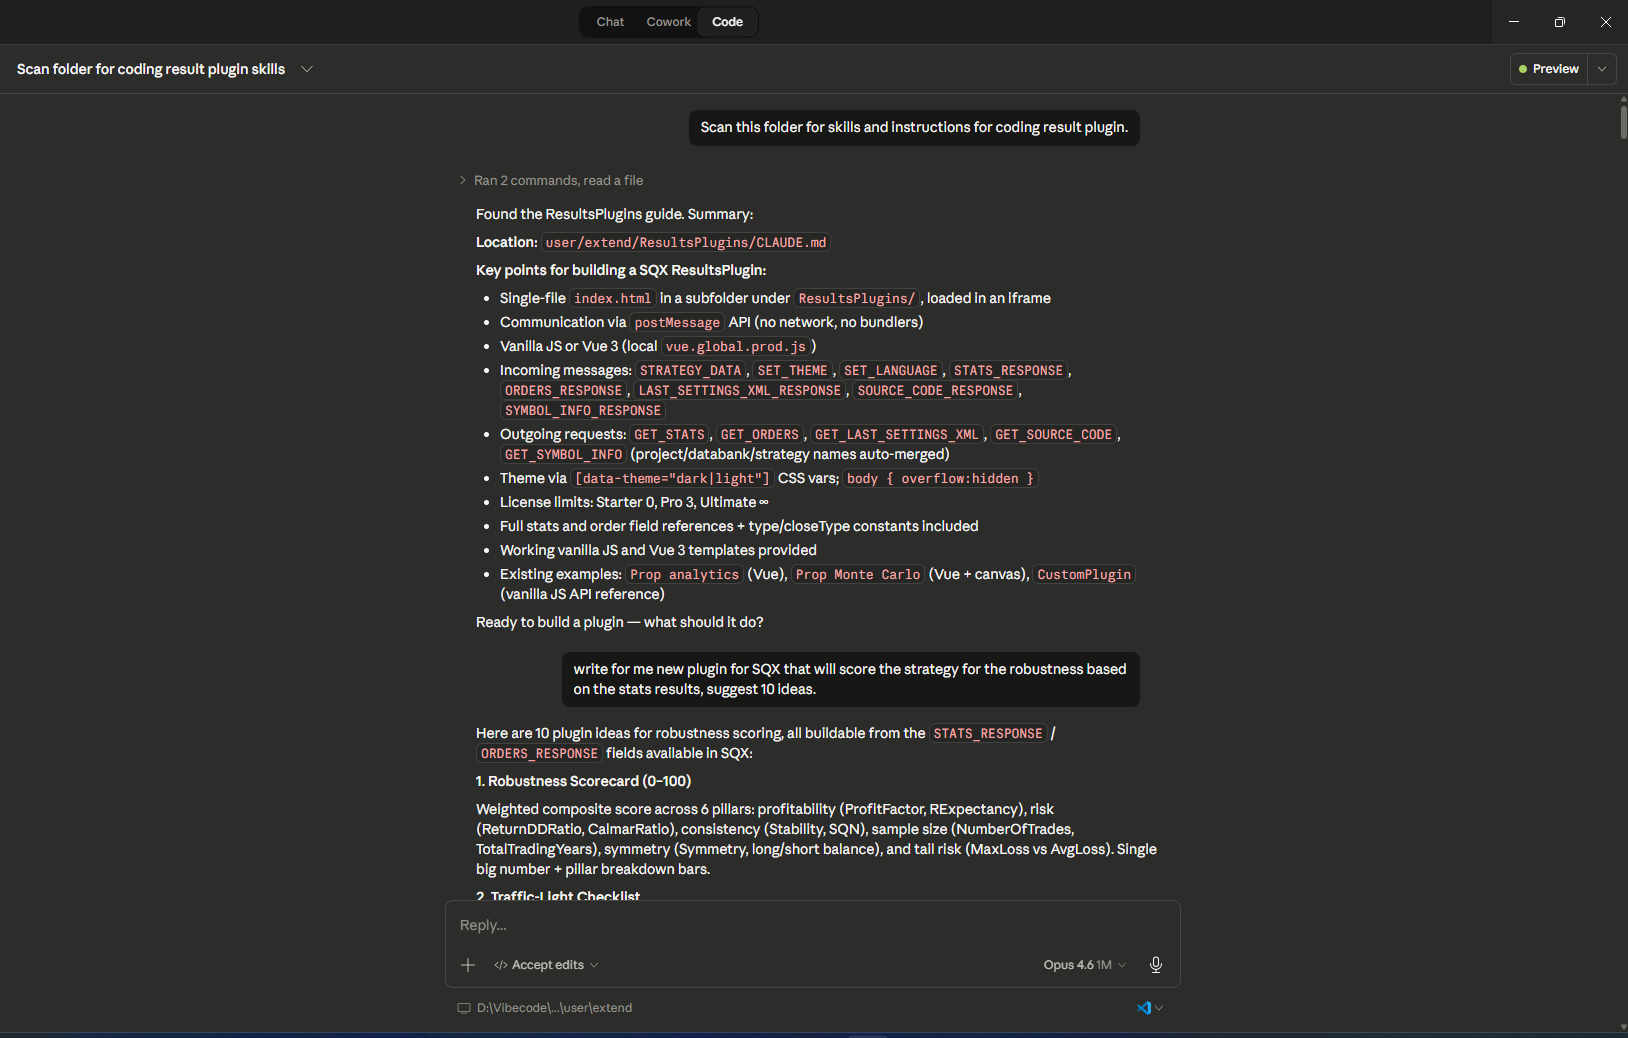
Send Claude your first message:
Scan this folder for skills and instructions for coding result plugin.
Claude reads CLAUDE.md and summarizes the key facts back to you: plugins live in their own subfolder with a single index.html, communication with SQX happens exclusively via postMessage, the body must use overflow:hidden, Vue 3 is supported through a local runtime, and so on.
This context-loading step is essential. Once Claude confirms it understands the environment, everything it produces afterward will respect SQX conventions without you having to restate them.
[Screenshot: Claude Code chat window showing Claude's summary of the plugin architecture after reading CLAUDE.md.]
Step 3 — Brainstorm plugin ideas
Rather than committing to one implementation right away, ask Claude for options:
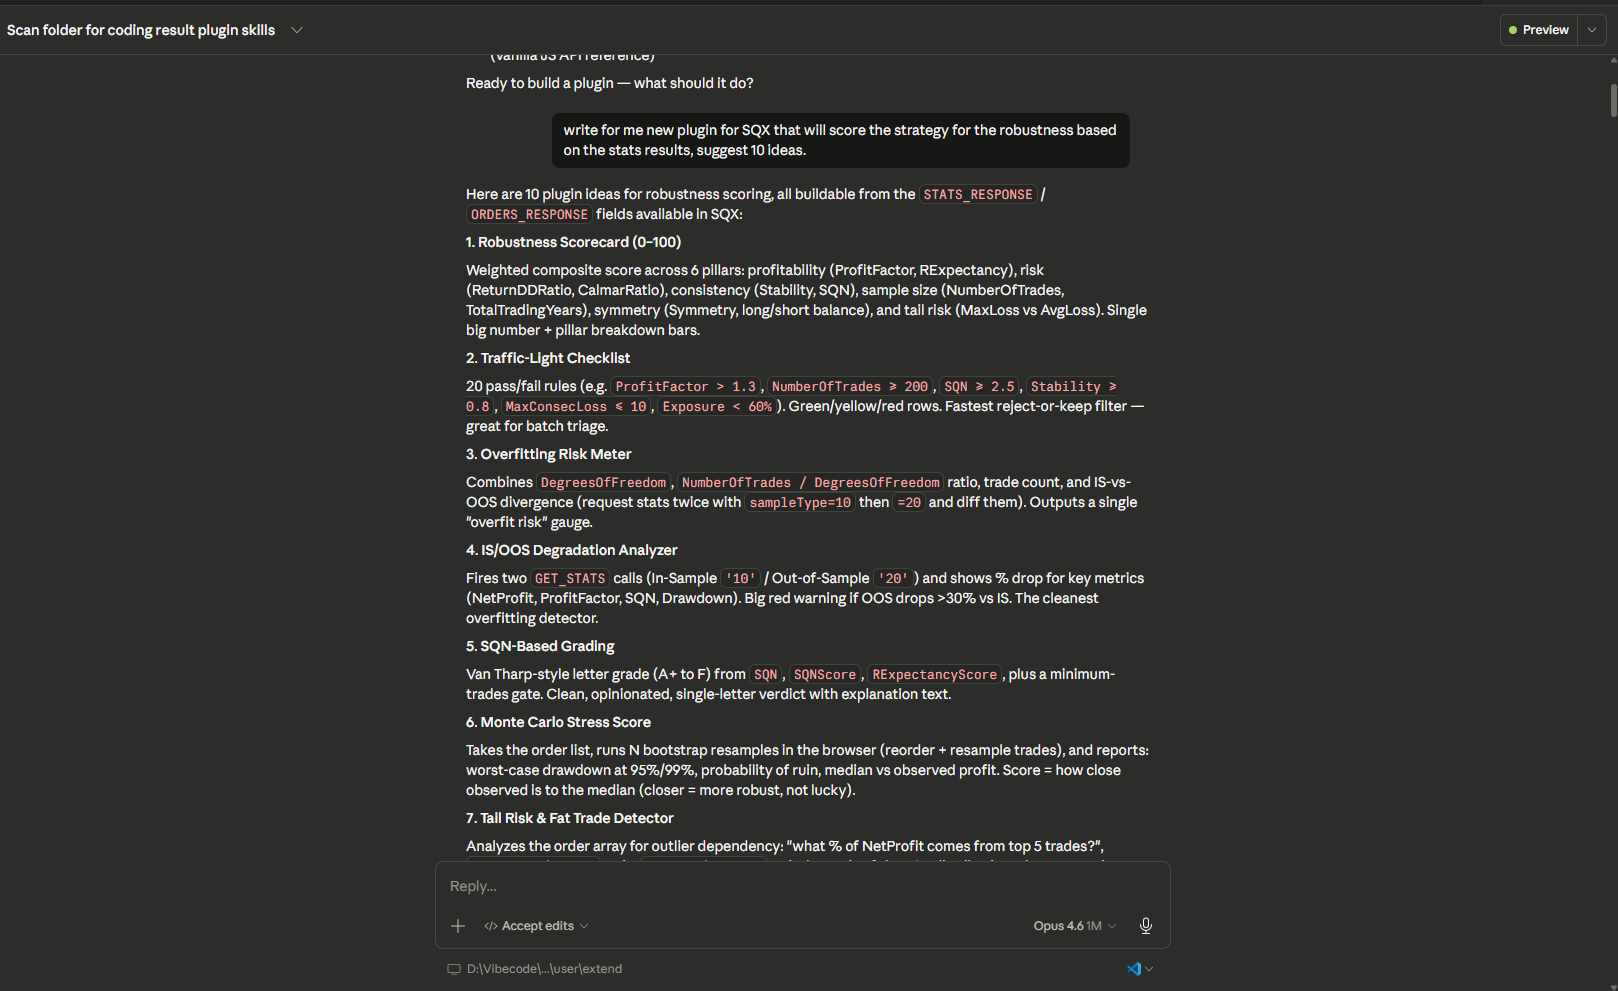
Write for me a new plugin for SQX that will score the strategy for robustness based on the stats results, suggest 10 ideas.
Claude responds with ten different approaches — weighted scorecards, traffic-light checklists, IS/OOS analyzers, Monte Carlo stress tests, radar charts, tail risk detectors, overfitting meters, and more. Each idea comes with a short description and the stats fields it would rely on.
This brainstorming phase is one of the biggest advantages of working with an AI collaborator. You see a range of options you might never have considered, and you stay in control of the final direction.
[Screenshot: The list of 10 plugin ideas in the Claude Code chat, with short descriptions under each.]
Step 4 — Request an implementation plan
Once you've picked an idea, ask for a detailed plan before any code is written:
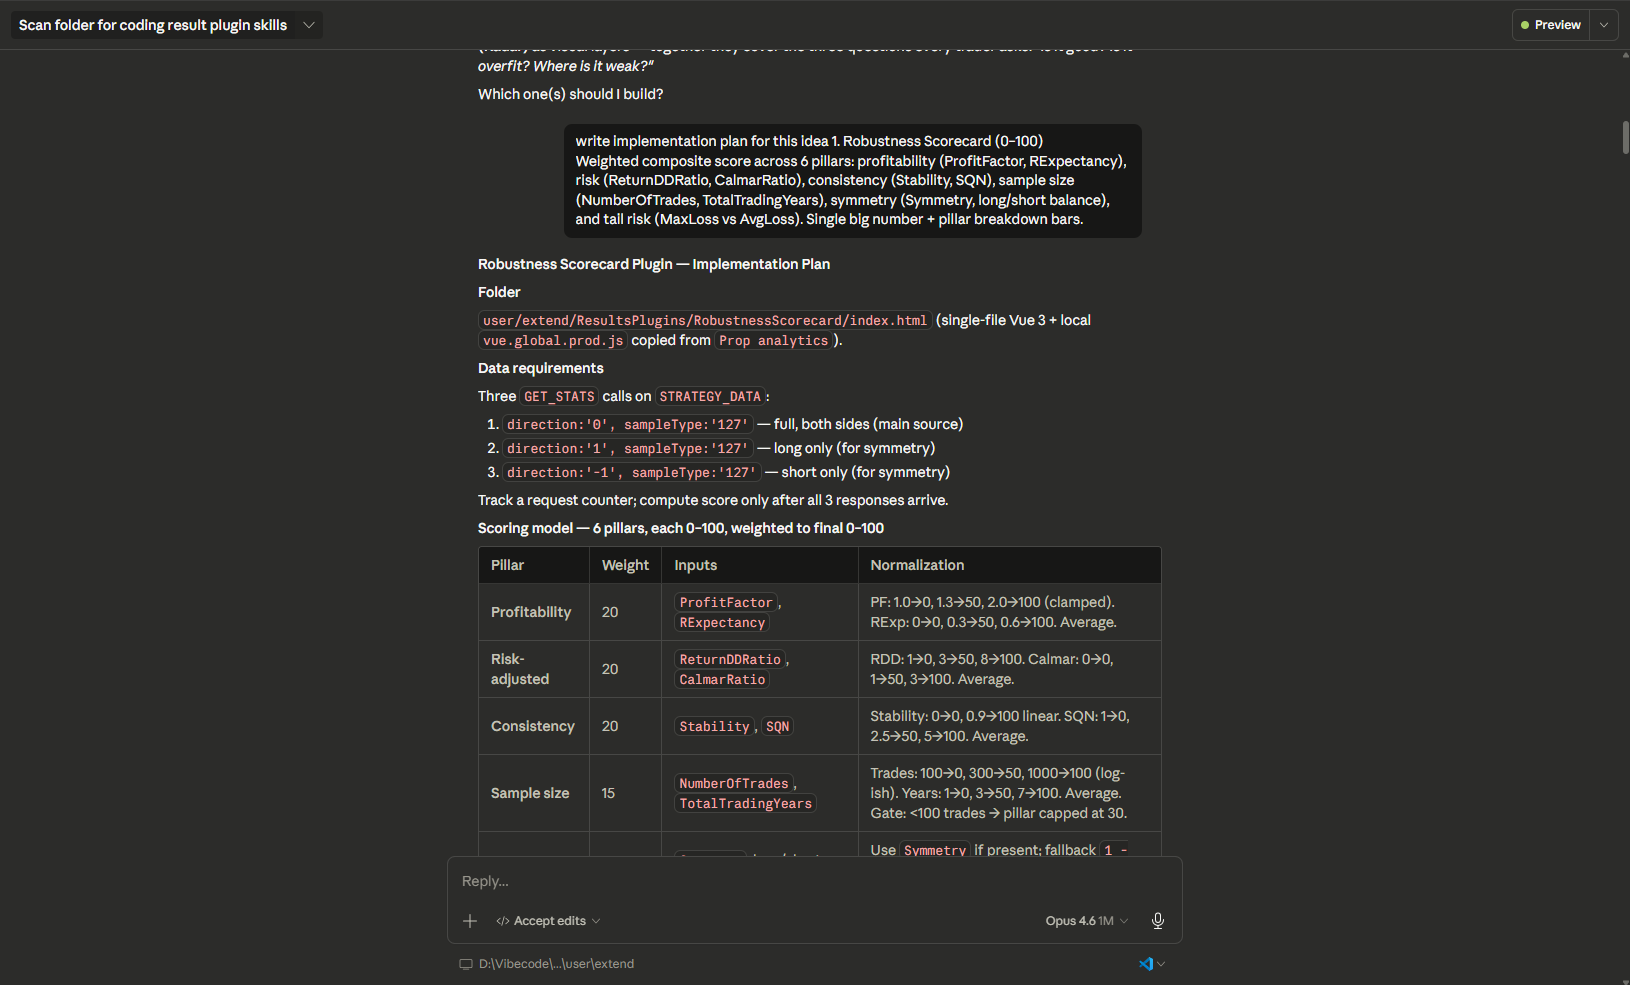
Write implementation plan for idea 1. Robustness Scorecard (0–100).
Claude produces a step-by-step plan: the folder structure, the data it will fetch (three parallel GET_STATS calls — both directions, long only, short only), the scoring model with six pillars and their weights, the normalization points for each metric, the UI layout with a score circle and pillar bars, the build order, and an explicit list of scope cuts for things that will not be in version one.
Read the plan carefully. This is the cheapest moment to change direction — fixing a conceptual error now takes one sentence, while fixing it after implementation takes several iterations.
[Screenshot: The implementation plan in the chat, showing the pillar weights table and the scoring configuration.]
Step 5 — Approve and generate the code
When the plan looks right, a simple confirmation is enough:
ok do it
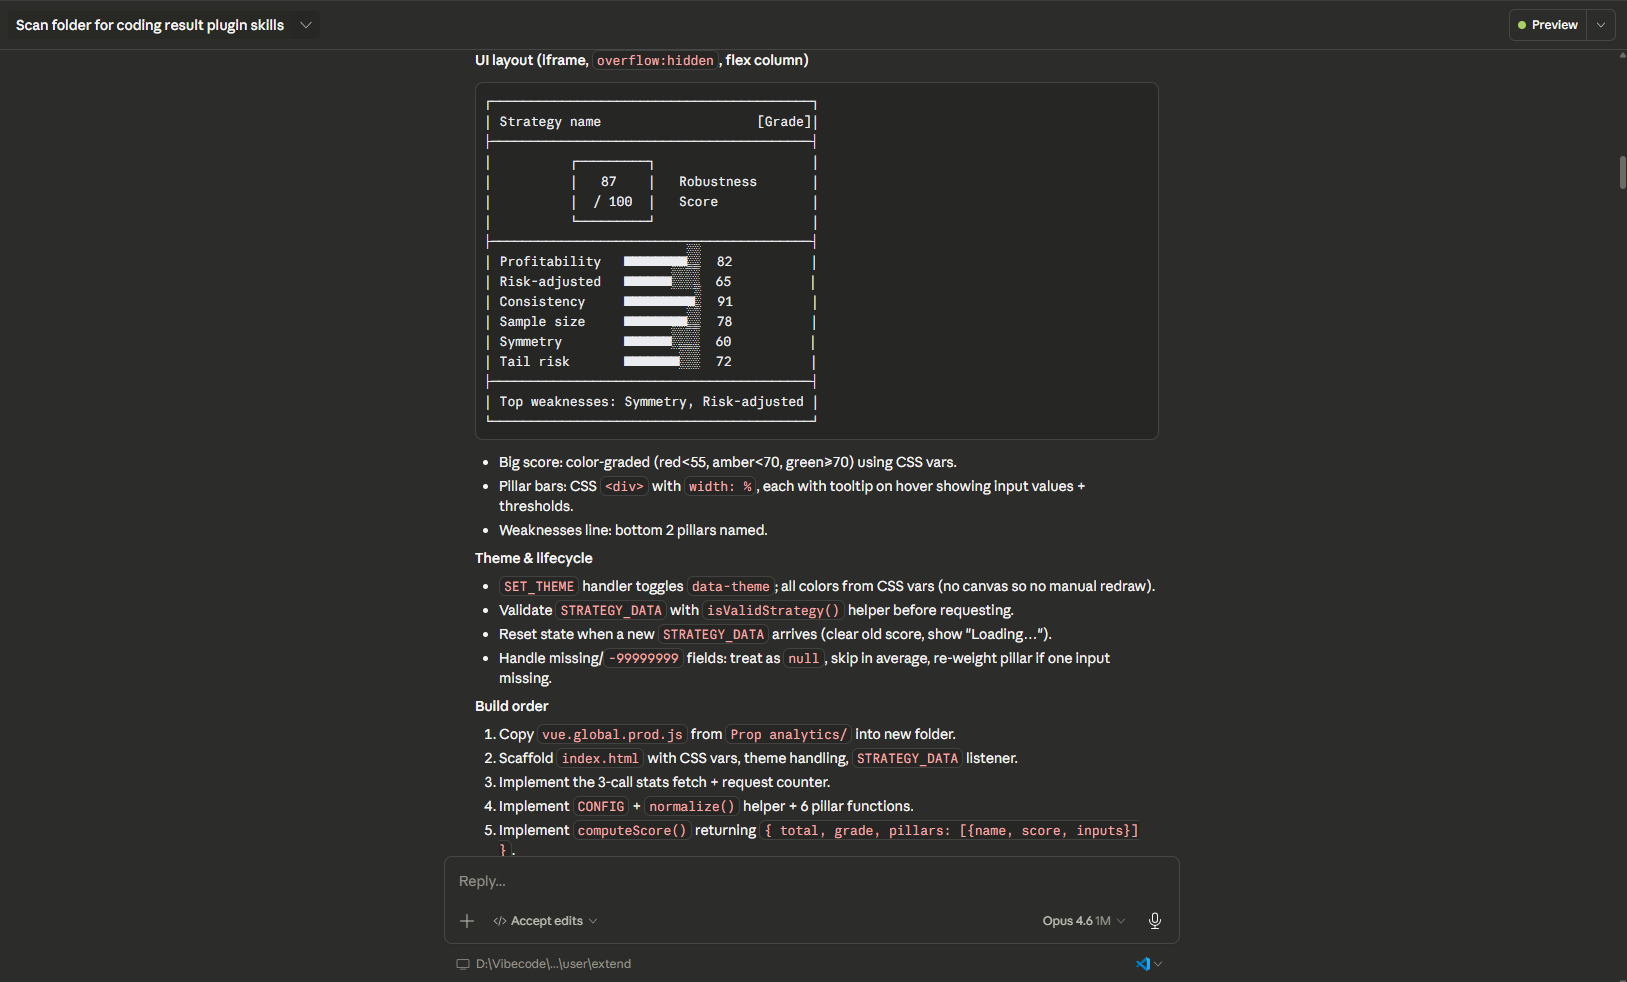
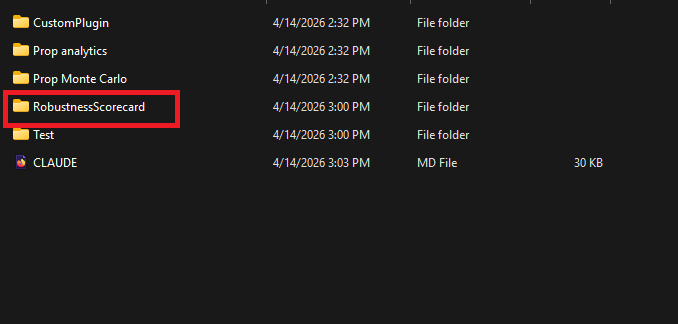
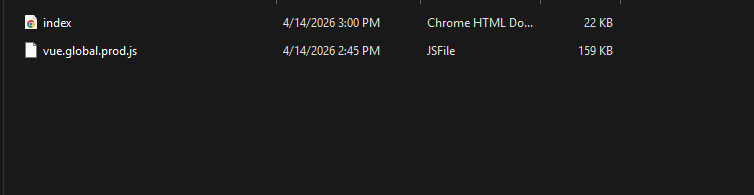
Claude creates a new RobustnessScorecard/ subfolder, copies the vue.global.prod.js runtime from an existing plugin (SQX runs offline, so all dependencies must be local), and generates a single index.html containing:
- CSS variables for light and dark theming
- A Vue 3 application with a
message event handler - Three parallel
GET_STATS requests with a counter that waits for all responses before computing - A
CONFIG object holding pillar weights - A
norm() function for piecewise-linear metric normalization - The six pillar calculations with fallbacks for missing data
- A low-trade gate (under 100 trades caps the sample pillar at 30)
- Automatic re-weighting when a pillar has no valid inputs
- The complete UI: score circle, letter grade, verdict, top weaknesses, and pillar bars
Approximately 500 lines of production-quality code in a single file, ready to drop into SQX.
[Screenshot: The newly created RobustnessScorecard folder in the file tree with index.html and vue.global.prod.js visible.]
Step 6 — Add the standard disclaimer
Any tool that interprets trading performance must include a disclaimer. Claude already knows this rule from CLAUDE.md, but you can trigger the step explicitly:
Also add disclaimer matching the other plugins.
Claude looks at how Prop analytics and Prop Monte Carlo implement their disclaimers, applies the same CSS class (11px, muted color, border-top, justified text, flex-shrink:0), and places the block as the last element inside #app. For the scorecard specifically, Claude adds one extra sentence clarifying that a high score does not guarantee future performance and a low score does not guarantee failure.
Because Claude matches the pattern used by existing plugins, the disclaimer is visually consistent with the rest of the Results tab.
[Screenshot: The plugin preview showing the disclaimer bar at the bottom of the iframe, under the pillar bars.]
Step 7 — Add tooltips with practical explanations
This is the step that turns the plugin from a quant tool into something anyone can use:
Also do the tooltips with practical explanation.
Claude adds a pure-CSS tooltip pattern ([data-tip]:hover::after with white-space: pre-line) and creates a single centralized TOOLTIPS object at the top of the script. Every tooltip follows a three-question structure:
- What it is — a plain-language definition
- How to read it — concrete weak / OK / good thresholds
- Why it matters — a short real-world example
For example, the Profit Factor tooltip reads:
Profit Factor = gross profit ÷ gross loss.
Weak: <1.2 · OK: 1.2–1.5 · Good: 1.5+.
Example: 1.87 means you earn $1.87 for every $1 lost.
Tooltips are attached to the title, the big score, the letter grade, every pillar name, and every raw metric the plugin displays. A subtle dotted underline marks what's hoverable so users can discover them.
[Screenshot: A tooltip popping up on hover over "Robustness scorecard"]
Step 8 — Update CLAUDE.md for future plugins
This is the step that compounds across time. Ask Claude to document what it just learned:
Update CLAUDE.md — add instructions about tooltips with practical examples and about the disclaimer. Check the other plugins for what they already use.
Claude scans the existing plugins for their disclaimer markup and styling, writes a new "Tooltips & Explaining Metrics to Users" section covering the three-question rule, the pure-CSS tooltip pattern, ready-to-use copy for common metrics, and five practical examples. It also adds a "Disclaimer (Required)" section with the standard text, the standard CSS block, the correct placement in the layout, the i18n pattern, and a review checklist. Finally, it adds RobustnessScorecard to the Existing Plugin Examples table.
After this step, the next plugin you build starts from an improved baseline — the platform literally learns from its own extensions.
[Screenshot: The CLAUDE.md file in the results plugin folder.]
Step 9 — Test the plugin inside StrategyQuant X
Close SQX and start it again (or click the reload icon in the Results tab). Open any strategy from a Databank, go to the Results tab, and you should see Robustness Scorecard listed alongside the existing plugins.
What to verify:
- The overall score and letter grade compute correctly
- All six pillar bars render with appropriate colors — red, amber, or green depending on the score
- Hovering over pillar names, the score circle, the grade, and every raw metric shows a tooltip
- Switching the SQX skin between light and dark mode switches the plugin as well
- A strategy with fewer than 100 trades sees its Sample Size pillar capped at 30
- A one-sided strategy (long-only or short-only) is penalized on the Symmetry pillar
If anything goes wrong, open the plugin's browser DevTools (right-click inside the plugin → Inspect), copy any errors from the console, paste them into Claude Code, and let Claude fix them. You never leave the conversation.

[Screenshot: The SQX Results tab with the Robustness Scorecard tab selected and a real strategy loaded, showing the computed score and all pillars.]
Step 10 — Iterate
This is where custom plugins stop feeling like a one-shot deliverable and start feeling like a living tool. Every follow-up request to Claude can be free-form — it already knows the full source code and can make targeted changes. Common follow-ups:
- "Make the pillar weights configurable from inputs at the top of the plugin."
- "Add locale files for en/cs/de and wire them up to SET_LANGUAGE."
- "Add a history panel showing the last 5 strategies I scored."
- "Add a 7th pillar for time consistency based on monthly profit distribution."
- "Let me export the current scorecard as a PNG."
Claude preserves the structure you already have and adds only what you asked for.
Tips for productive vibecoding
Always request a plan before code. Reading an implementation plan costs you thirty seconds and saves you thirty minutes of iteration if the design is wrong.
Keep configuration centralized. Thresholds, weights, tooltip copy, color rules — ask Claude to put them all into a CONFIG or TOOLTIPS object at the top of the file. This makes tuning trivial and future translation possible.
Let CLAUDE.md grow. Whenever you notice yourself repeating a rule ("always add a disclaimer, always add tooltips, always match the existing theme"), ask Claude to write it into CLAUDE.md. Future plugins will inherit the rule automatically.
Test on strategies with different profiles. Try a strategy with few trades, a one-sided strategy, a highly profitable one, and a barely profitable one. If the scoring doesn't match your expectations, adjust the normalization points — one sentence to Claude is enough.
Don't rush. One good plugin per afternoon is a realistic pace. A polished tool you trust is worth more than several half-finished ones.
What you can build next
The Robustness Scorecard is only the beginning. During the initial brainstorming step, Claude suggested nine other plugins — each one buildable in a single session using the same workflow described above:
| Plugin idea | What it does |
|---|---|
| Traffic-Light Checklist | 20 pass/fail robustness rules rendered as red/amber/green rows |
| Overfitting Risk Meter | Combines trades, degrees of freedom, and IS/OOS divergence into one gauge |
| IS/OOS Degradation Analyzer | Compares in-sample vs out-of-sample metrics and flags large drops |
| SQN-Based Grading | Van Tharp-style letter grade with an explanatory verdict |
| Monte Carlo Stress Score | Bootstrap resampling in the browser with ruin probability output |
| Tail Risk & Fat Trade Detector | Identifies strategies held together by a few lucky trades |
| Time Consistency Analyzer | Rolling profit factor by month and year |
| Risk-Adjusted Ratio Panel | Focused dashboard of the eight key "survivor" ratios |
| Robustness Radar Chart | Spider-diagram visualization across six to eight robustness axes |
Every one of these is approximately one afternoon of conversation with Claude Code. And because CLAUDE.md now contains the reusable patterns from Robustness Scorecard — tooltip rules, disclaimer standards, theming conventions — each subsequent plugin starts from a higher baseline than the previous one.
Existing Example Plugins
Prop analytics
Location: user/extend/ResultsPlugins/Prop analytics/
Tech stack: Vue 3 (local runtime) + pure CSS, single index.html
Purpose: Advanced statistical dashboard designed specifically for evaluating strategies against proprietary trading firm rules (FTMO, TopStep, and similar).
What it does
Prop analytics takes a single strategy and runs it through the lens a prop firm would use before accepting or rejecting your account. Instead of showing generic statistics, it answers the exact questions a funding evaluation asks: "Would this strategy have broken the daily drawdown limit? Did a single day generate too much of the profit? How close did it ever get to failing?"
The plugin lets the user configure the evaluation parameters at the top — starting capital, daily drawdown limit, contract size, maximum allowed leverage, and a "post-streak threshold" for edge detection. Everything below recalculates live.
[Screenshot: The Prop analytics input panel with the evaluation parameters (Starting Capital, Daily DD Limit, Contract Size, Max Leverage, Post-Streak Threshold).]
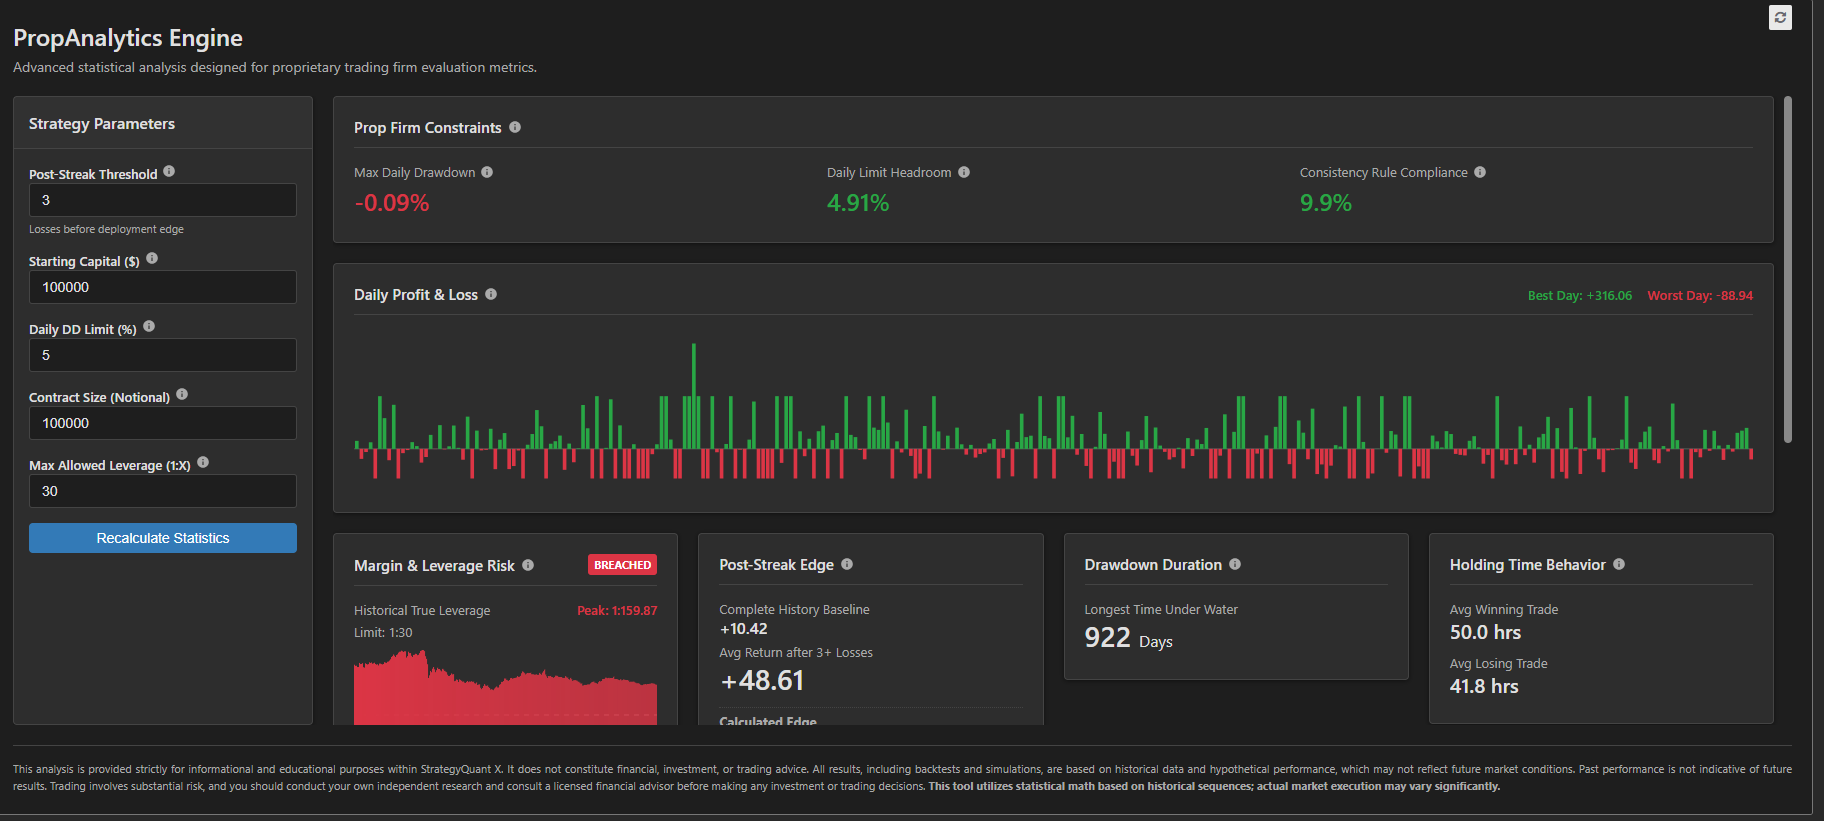
Key analytics cards
Prop analytics is built as a grid of focused cards, each answering one question:
- Prop Firm Constraints — worst single-day drawdown, daily-limit headroom, consistency rule compliance (the "no single day over 30–50% of profit" rule used by most firms)
- Daily Profit & Loss — chronological green/red day blocks with best-day and worst-day highlighting
- Margin & Leverage Risk — simulates the firm's margin rules by computing True Leverage (notional value of concurrently open trades ÷ account balance) and flags breaches
- Post-Streak Edge — measures whether there's a statistical edge to waiting for X consecutive losses before deploying the strategy (baseline return vs post-streak return, win rate after losses, average recovery time)
- Drawdown Duration — longest time under water in days
- Holding Time Behavior — compares average winning-trade duration to average losing-trade duration and flags asymmetric behavior (holding losers longer than winners is a classic psychological red flag)
- Consistency Score — monthly standard deviation and percentage of profitable days
- Tail Risk (95%) — Value at Risk and Expected Shortfall (CVaR) for the worst 5% of days
- Regime Performance — classifies which market environment (Momentum, Choppy, High Volatility) the strategy thrives in versus bleeds in
Patterns it demonstrates
Prop analytics is the reference plugin for anything that involves orders-level processing. It fetches the full order list via GET_ORDERS and derives daily P&L, leverage exposure, streak frequencies, and recovery times entirely in JavaScript — nothing comes pre-computed from SQX.
It's also the reference for localization. The plugin ships with full translations in twelve languages (en, cs, de, es, fr, id, it, pl, pt, ru, zh-CN, zh-TW), all stored in the locales/ subfolder as flat JSON files. Every user-facing label and every tooltip comes from a locale key. The Vue helper tHtml() renders HTML-containing strings so tooltips can include <strong> and <br> tags.
And finally, it's the reference for rich tooltips. Almost every metric and card title has a data-tip attribute backed by a tooltipHtml locale key. The tooltip text doesn't just define the metric — it explains why a prop firm cares about it, often with a concrete dollar example ("If you start Tuesday with $100,000, win to $102k, but then close a loser to drop to $96,000, your daily drop is 4%…").
Prop Monte Carlo
Location: user/extend/ResultsPlugins/Prop Monte Carlo/
Tech stack: Vue 3 (local runtime) + HTML5 Canvas, single index.html
Purpose: Runs Monte Carlo simulations on a strategy's trade sequence to answer the question: "How likely is this strategy to survive a prop firm evaluation under randomized trade orderings?"
What it does
A single backtest is one specific ordering of trades. Monte Carlo asks: what if the same trades had happened in a different order? By shuffling the trade sequence thousands of times and replaying each permutation against the prop firm's rules, the plugin produces a distribution of possible outcomes instead of a single lucky-or-unlucky number.
Prop Monte Carlo takes the order list via GET_ORDERS, lets the user configure the simulation parameters (number of iterations, confidence level, starting capital, daily loss limit, max drawdown limit, profit target), and runs the whole thing in the browser. The output is a visual distribution plus the key percentiles — a realistic probability of passing the evaluation.
Key features
- Client-side simulation — all randomization and replay logic runs in JavaScript; there's no server, no external API
- User-configurable parameters — iteration count, confidence levels, and prop firm rules (daily loss, max drawdown, profit target)
- Canvas-based visualization — the distribution, equity fan, or percentile bands are rendered directly to a
<canvas> element, with aResizeObserver handling iframe resizing and a manual redraw onSET_THEME changes - Pass/fail probability — the headline output: "Under these rules, this strategy passes the evaluation in X% of simulated runs"
- Full localization — same twelve-language setup as Prop analytics, with
disclaimerHtml and all labels in thelocales/ folder
[Screenshot: Close-up of the canvas chart showing the Monte Carlo distribution with percentile markers overlaid.]
Patterns it demonstrates
Prop Monte Carlo is the reference plugin for anything involving a <canvas> chart. Key things to notice:
- The canvas is sized dynamically via
ResizeObserver (notwindow.resize, because the SQX iframe can resize independently) - Canvas paint colors are read from CSS custom properties via
getComputedStyle() at draw time — CSS variables alone don't affect canvas paint, so every theme change triggers a manualdrawChart() call - The drawing code is isolated from the Vue reactivity system; Vue manages the UI chrome and the canvas drawing is a plain function called from lifecycle hooks
It's also the reference for simulation-heavy compute in the browser. The loop structure and the way reactive state is updated during iteration keep the UI responsive even during long runs.
Conclusion
Custom Results plugins in StrategyQuant X used to be something only developers could build. With the Claude Code desktop app, they're now something any trader with a clear idea can build in an afternoon — and the workflow in this guide is the exact sequence that produced the first one.
To start your own plugin, open user/extend/ResultsPlugins/ in Claude Code and run through the ten steps above, substituting your own idea for the Robustness Scorecard. The full source of the example plugin is in your ResultsPlugins/RobustnessScorecard/ folder — use it as a reference any time you want to see how a finished plugin is structured.
Was this article helpful? The article was useful The article was not useful