Documentation
Applications
Last updated on 6. 5. 2015 by Mark Fric
Walk-Forward Matrix
Page contents
Walk-Forward Matrix is a powerful, unique feature in StrategyQuant platform. It can help you with two things:
- Verify strategy robustness
if the strategy passes Walk-Forwad Matrix test it means that with the help of parameter reoptimization it is adaptable to a big range of market conditions - Find the optimal period for strategy reoptimization
it will help you identify the best optimization frequency
Standard Walk-Forward Optimization tests the strategy results with periodic reoptimization, let’s say every 300 days.
But how do we know what is the best reoptimization period? We can only guess, unless we’ll use Walk-Forward Matrix that will test various combinations of reoptimization periods.
What is Walk-Forward Matrix?
It is simply a set of Walk-Forward optimizations performed with different number of reoptimization periods and different Out of Sample %.
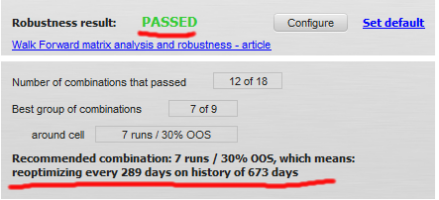
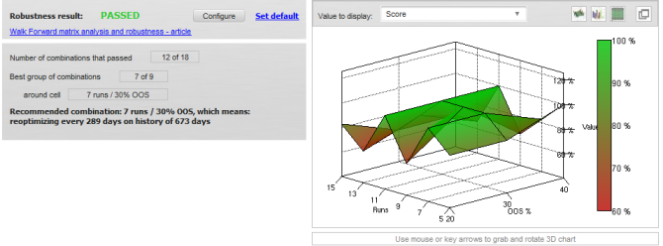
The result of WF Matrix could look like on the image below – showing the total result plus the ideal reoptimization period.
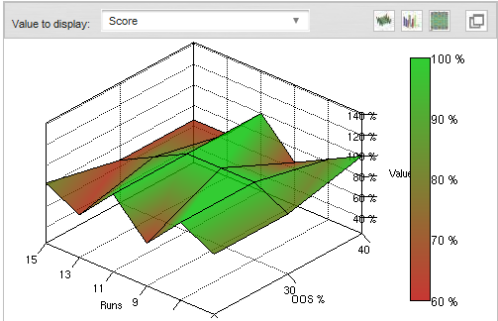
It will also show a 3D chart of scores (robustness results) all combinations of OOS / runs performed in this WF matrix.
This chart and table will be explained in the bottom of this article, let’s start with the complete example first.
Walk-Forward Matrix example in StrategyQuant
Performing Walk-Forward Matrix is almost as simple as performing WF optimization, in the next few lines I’ll show the complete process.
The whole process of using WF Matrix is almost as same as using a WF optimization, so in this example I’ll describe only the differences.
You can refer to Walk-Forward Optimization example for the details about undescribed steps.
Contents:
- Loading a strategy for optimization
- Setting optimization values
- Configuring walk-forward runs
- Checking the results
- Interpreting the results
Step 1: Loading a strategy for optimization
We have to switch to Optimizer window and load the strategy we want to optimize.
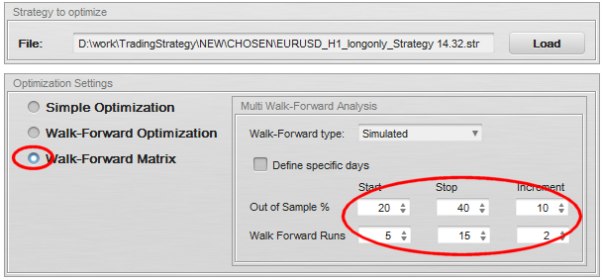
This time we’ll switch to Walk-Forward Matrix mode and set the parameters. WF Matrix performs a series of single Walk-Forward optimizations, so we have to configure which number of periods (runs) and OOS % it will go through. For this we can use Start, Stop and Increment fields.
In the matrix we have to specify which combinations we want to test for Walk-Forward Optimization. In our example, we’ll use periods 5, 7, 9, 11, 13, 15 runs and OOS % 20, 30, 40.
Note!
Computation of Walk-Forward Matrix is very time-consuming, because it has to run full Walk-Forward optimization for every combination in the matrix. It is better to not set too many steps, at least if you want to have the results relatively quickly.
There is a new type of Walk-Forward optimization available – Simulation – which can improve the speed of computing Walk-Forward optimization or WF matrix 10-100x faster.
Step 2: Setting optimization values
Step 3: Configuring walk-forward runs
These settings are set in the same or very similar way as in Walk-Forward Optimization example.
We can click on the Start button to start testing.
Step 4: Checking the results
As said before, Walk-Forward Matrix analysis could take very long time, so wait until it is finished. You can use less parameters, less steps and less WF combinations to decrease the number of tests needed and make the analysis finish quicker.
When the optimization is over, we once again get a new Walk-Forward Matrix result in our databank.
When it finishes, we’ll see that we have only two results in the databank – Original strategy and Walk-Forward matrix result.
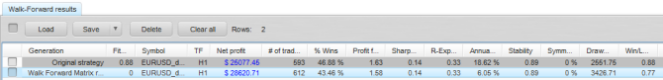
The WF matrix result in databank shows us the best Net Profit from all the performed Walk-Forwad optimizations. Let’s double click on the WF result in the databank to open it in details.
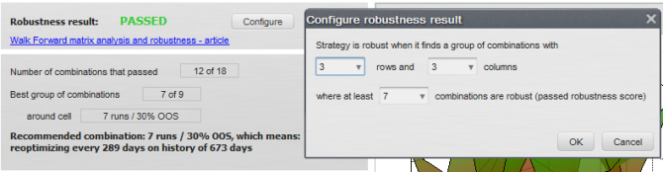
The details show the final robustness test result – whether the strategy passed or failed the test – and a configurable 3D chart that can display results for all the matrix combinations.
Below the final results you can choose any Walk-Forward combination that was tested and see the detailed results below.
When we’ll switch to Equity chart we’ll also see the results of Walk-Forward optimization for a selected combination from WF Matrix table.
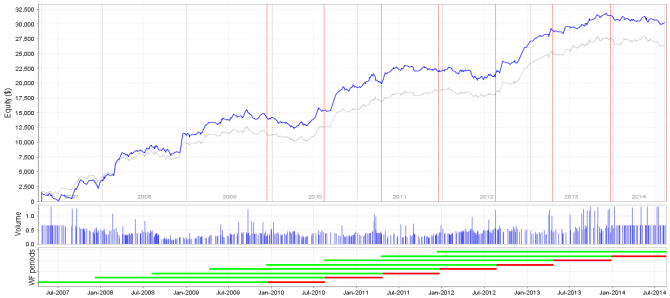
Blue line represents reoptimized strategy and thinner gray line represents original non-optimized strategy.
We can clearly see that this strategy performs better if it is periodically reoptimized.
Note that these results and equity chart are displayed for the selected optimization – 7 runs with 20% OOS. If you choose another combination, the results and chart will look different.
Interpreting the results
As stated in the beginning of this article, Walk-Forward Matrix serves both as a strategy robustness check and as a tool to find the optimal period for strategy reoptimization.
Using Walk-Forward matrix as a robustness check
Optimizing strategy using Walk-Forward optimization with various parameters allows us to see if the strategy “survives” during different reoptimization periods, with different history length on which it was optimized.
The Score 3D chart shows us robustness result for every parameter combination, it is a great tool for identifying and avoiding over-optimization (curve-fitting). Robust strategies will appear to have gradual, rather then abrupt changes in the surface plot.
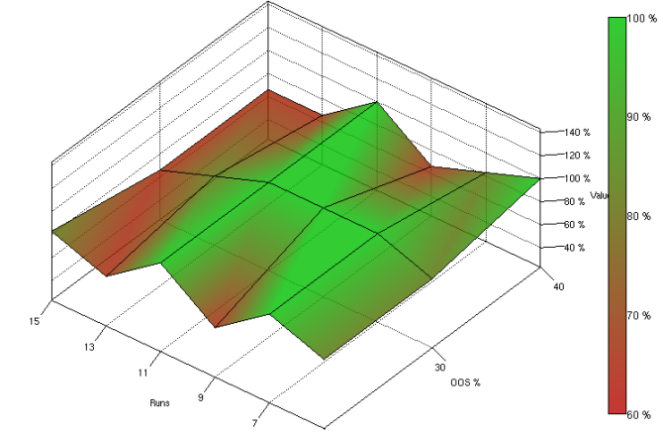
What we are looking for is that as many as possible WF combinations are successful.
As the minimum I’m looking for a cluster of at least 3×3 combinations where there are more successes than failures.
When we click on Configure button we can set it so StrategyQuant recognizes this automatically – in our example we want a group of 3×3 combinations of single Walk-Forward tests where at least 7 of these 9 Walk-Forward tests are successful.
In our example there are two such clusters, their boundaries are drawn with yellow and blue color. In both cases 7 out of 9 Walk-Forward tests passed (indicated by the green color, the tests are marked with red circles).
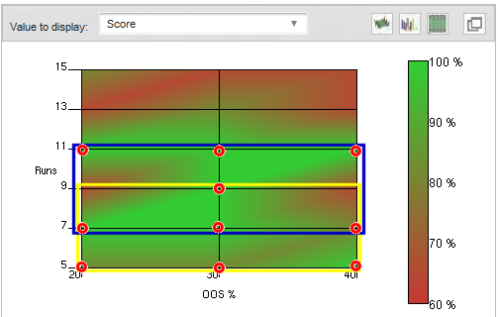
If just one such 3×3 group is found in the matrix, I consider the strategy robust. This group means that not only the strategy benefits from reoptimization, but that it also can be reoptimized using different periods and it still keeps its profitability – this is a sign of robustness.
What determines a success of a single Walk-Forward optimization?
Above we evaluated all the tested Walk-Forward combinations to determine if the strategy is robust by checking that majority of single WF optimizations passed our criteria.
But how did we decide that a single Walk-Forward optimization passed or not?
For this we use customizable Robustness score that is computed for every single Walk-Forward optimization.
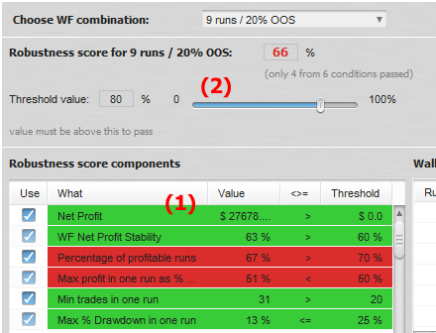
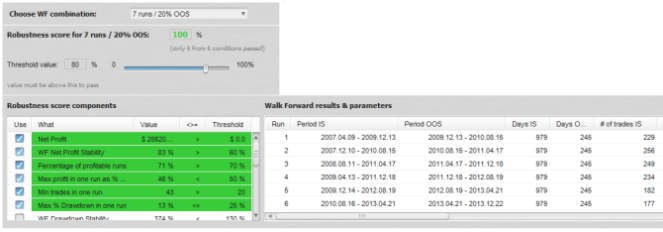
Robustness score is fully customizable. We can set all the conditions we want to watch in the Robustness score components table (1) and set their boundary values. Check the description of advanced score components in Walk-Forward Optimization article.
The main Robustness score threshold value (2) means how many of these scores used must pass in order for WF result to be considered successful.
We can see that for example 9 runs / 20% OOS failed because 2 out of 6 scores did not pass – the robustness score is only 66% (4 out of 6 is 66%) instead of required 80 % passed score values.
It is always good to look at the combinations that failed – what was the reason for their fail?
We should look also at the details. Do you have all the combinations Failed? Perhaps your success criteria are too tight.
Using Walk-Forward Matrix to find the optimal reoptimization period
This is the natural extension of robustness check. When we found for example a 3×3 group of single Walk-Forward optimizations, I prefer to select the one that is in the middle of it.
StrategyQuant does this automatically for us (if we configured it properly and the result is displayed just below the final result:
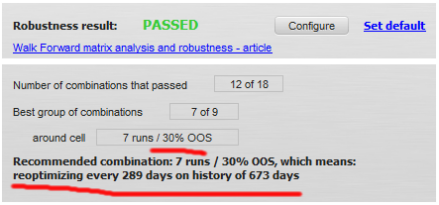
Remember, the strategy should be robust also to reoptimization settings – so the exact reoptimization date shouldn’t matter, as long as we’ll keep the reoptimization and history period roughly as they should be.
In case of this strategy I can reoptimize the strategy just now (august) on a history of 2 years, and I intend to reoptimize it again next year in august (a year from now).
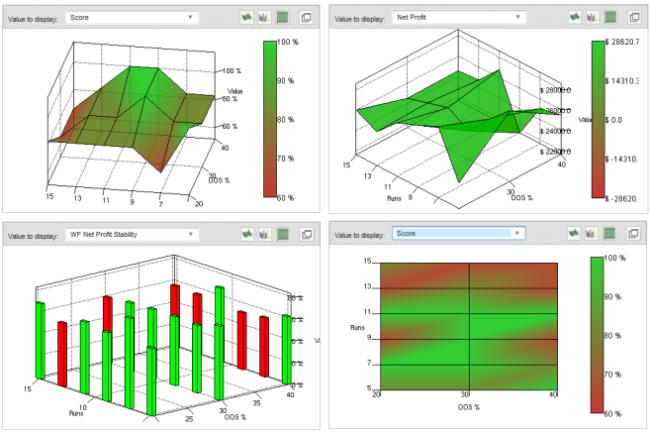
Advanced 3D charts
New StrategyQuant offers you a new feature – 3D charts of all the Walk-Forward combinations performed. As already mentioned, 3D chart shows value for every parameter combination and it is a great tool for identifying and avoiding over-optimization. Robust strategies will appear to have gradual changes in the surface plot.
You can display 3D chart of Net profit, Drawdown, Stagnation, Profit Factor, Stability or any other value in three different fashions – as surface, bar chart or a heatmap.
Tip – check also article Description of advanced Walk-Forward values for description of various values you can be used in filters or shown in databank.
Was this article helpful? The article was useful The article was not useful
Hi,
I am looking that in the new SQ version there is not the parameter WF net profit stability, which could be the option to select? can you create a new guide with the new parameters for SQ4 ?